Abstract
Have you ever thought which place could be the best for sky observation? When should you enjoy clear sky? A lot people like astronomy and usually they observe astronomical objects using telescopes or camera. Star observers and photographers should know the importance of the clear sky during an observation of astronomical objects such as the moon. The moon is the brightest object in the sky and it is the main reason why I started my project with creating an astronomical web program which will show the weather forecast by comparing it with other regions in a chosen country and also the moon phases for the next week. Firstly, users will get an opportunity to observe the moon from their window or in the parks near to their home. Secondly, they will get information about regions where cloud density is the lowest. Finally, users will know the moon phases for the next week so they can use it for an observation. In this case it becomes easy to observe astronomical objects without having problems with the cloudy sky and the location choice.
Table of Context
- Introduction to Astronomy Club Bot program
- Searching for Wolfram Data
- Creating Data Access Library
- Integrating Library into a Single Macro-Function
- Creating Cloud Micro-Site
- Conclusion
Please interact with the actual web project at the following location
Introduction to Astronomy Club Bot program
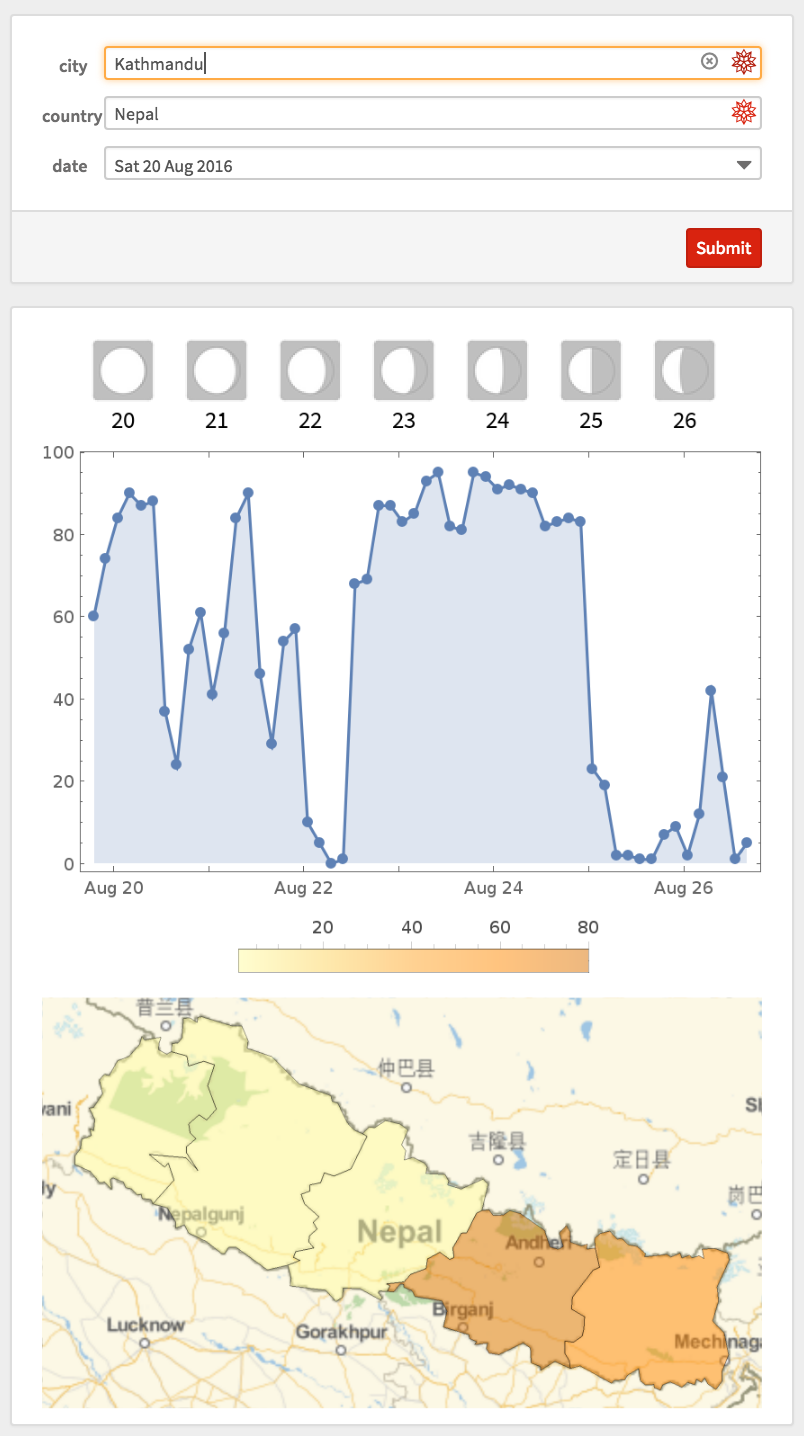
Astronomy Club Bot program has three inputs and a big output, which includes three important parts. First input is the name the of city where user wants to observe the Moon. The output has two parts related to each other. It shows the cloud cover and the moon phases for that week. Second and third inputs are the name of the country and the exact date of an observing. Third part shows map with the comparison of the cover densities in all regions of a chosen country. The main thing that I used during programming was the Wolfram Data and all functions related to my web project.
Wolfram Data used
- WeatherForecastData
- CloudCoverFraction
- AdministrativeDivisionData
- CountryData
- CityData
- Date
- MoonPhase
Creating Data Access Library
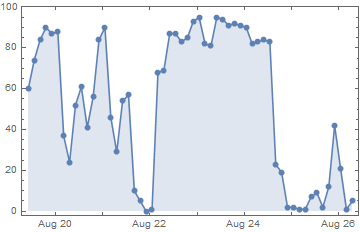
After researching all important information I started to code a simple functions and the Wolfram data helped me. Here is my first plot (part of the main output) which shows the cloud cover for 6 days in a chosen city. That is why I used CloudCoverFraction to got the cloud cover information.
cit[x_] :=
 DateListPlot[
  WeatherForecastData[GeoPosition[x], "CloudCoverFraction"],
  PlotRange -> All, Mesh -> All, Filling -> Bottom]
cit[Entity["City", {"Kathmandu", "Kathmandu", "Nepal"}]]
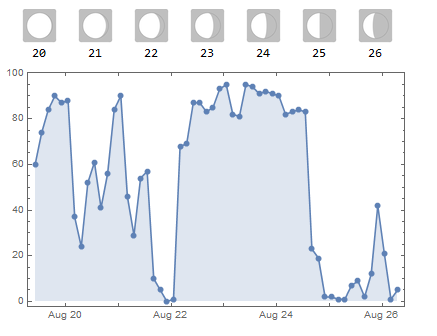
This is my second plot, which I connected with the first one (next output shows that). I used the MoonPhase function to got the illustration of the moon phase fraction for a current date. According to my written code the program counts days by assuming that the first day will be tomorrow (first=Tomorrow) so it adds the next 6 days to it and shows the moon phases for that days .
mn = Grid[{{ImageResize[#2, 35]}, {DateString[#, {"DayShort"}]}}] & @@@
   MoonPhase[
    With[{first = Tomorrow},
     DateRange[first, DatePlus[first, Quantity[6, "Days"]]]], "Icon"][
   "Path"]
Integrating Library into a Single Macro-Function
Here I connected two simple functions by using Grid function and gave them sizes .In that case I have two parts in the one output. That means my program will take the city name and give me information about the cloud density and also the moon phases for 6 days.
tg[y_] :=
 Grid[{{Row[mn, Spacer[9]]}, {Show[cit[y], ImageSize -> 400]}}]
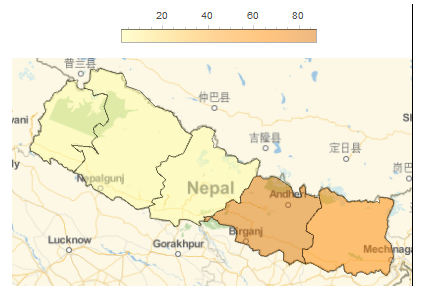
The AdministrativeDivisionData function helped me with the comparison of a regional cloud covers. The benefit of this data was that I found administrative divisions of all needed countries by using EntityList and EntityClass.
div[z_] :=
EntityValue[
 Entity["AdministrativeDivision", {EntityProperty[
     "AdministrativeDivision", "ParentRegion"] -> z}], "Entities"]
I made a function with WeatherForecastData for cloud cover prediction of the exact time.In this function I have two arguments, so they are responsible for the Date and the GeoPostion.
wt[time_][ad_] :=
 QuantityMagnitude[
  WeatherForecastData[GeoPosition[ad], "CloudCoverFraction", time]]
The pltF function shows a regional plot with administrative divisions and the main argument depends on the exact date and the country that user should input. I used a "ct" argument which I defined by mapping a "wt" and a "region" functions.
pltF[y__, ct_] :=
  GeoRegionValuePlot[Thread[y -> ct], PlotStyle -> Opacity[.5],
   GeoBackground -> "StreetMap",
   PlotLegends -> Placed[Automatic, Above], ImageSize -> 400];
mapperFunct includes two arguments and makes easy to get a division plot that shows the comparison of the cloud covers for each region. This plot is evaluating by getting information of date and position.
mapperFunct[country_, time_] := Module[ {regions, ct, ans},
  regions = div[country];
  ct = wt[time] /@ regions;
  ans  = pltF[regions, ct];
  ans
  ]
mapperFunct[Entity["Country", "Nepal"], Tomorrow]
Creating Cloud Micro-Site
In finalFunct I added all important functions that I programmed before. My function has 3 inputs with big output as I wanted. It means my function runs by depending on 3 arguments.
finalFunct[city_, country_, time_] :=
 Rasterize[Column[{tg[city], mapperFunct[country, time]}], "Image",
  "ImageSize" -> 800]
This is my final code of the web project where I used CloudDeploy function and included FormPage with 3 inputs. I changed my function permissions to Public, it means that program is opened for users so they can run my program and check the weather forecast for the moon observation.
CloudDeploy[
    Delayed[
       FormPage[{
         "city"-><|"Interpreter"->"City","Input"->"Kathmandu"|>,
         "country"-><|"Interpreter"->"Country","Input"->"Yerevan"|>,
         "date"->List[With[{first=Tomorrow},DateRange[first,DatePlus[first, Quantity[6,"Days"]]]]]},
       finalFunct[#city,#country,#date]&]],
"AstroClub",Permissions->"Public"]
Conclusion
Astronomy Club Bot program gives an opportunity for amateur astronomers to take pictures and observe the moon with telescope or camera. Users will know the moon phase and the weather forecast by choosing the exact day when they want to organize observation. They also can go to another region where the cloud density will be the lowest. The main idea of this project was making an observation more comfortable for users who can't leave his/her home or region. So I programmed it by using simple functions,wolfram data and documentation.
 Attachments:


