User Clustering by their Social Behaviour
My main goal in this project was to classify internet users using information publicly available on social sites. Among the many alternatives, I chose Reddit because I was able to find a rich database. Databasethe whole set of comments posted during May of 2015.
The main steps of my project have been
- Learning how to work with an SQL database in Mathematica
- Collecting information about random users
- Analysing the relevance of the Subreddit present in the data
- Creating a user feature vector
- Clustering the users through their feature representation
Learning how to use the Database
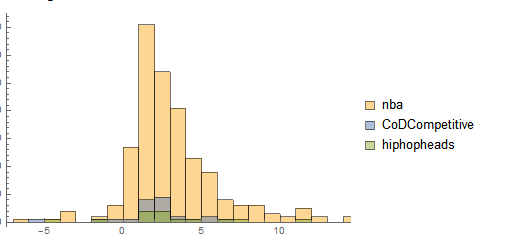
To start working on the database, I first checked the database description in order to correctly manipulate the data. To do that I need to know how to open SQLITE files in Mathematica. We must check the database description in order to correctly manipulate the data. As it was my first time, I wanted to start easy to get an idea of what could be done. For that I chose one random person from the dataset, and then tried to collect information about him (or her). I got up to 1000 rows and the columns "subreddit" and "score", but only if the value in the column "author" was "WyaOfWade" (a random user's name).
subreddit.commentsScore=SQLSelect[database,"May2015",{"subreddit","score"},
SQLColumn[{"May2015","author"}]=="WyaOfWade",
"MaxRows"->1000];
Then I grouped the results by the first element ("subreddit") returning the last one ("score"), and computing the length of the vector to see how many comments are on a given
GroupBy[commentsScore, First -> Last, Length]
The result in Column form is
nba->306
nfl->2
CoDCompetitive->32
hiphopheads->17
Boxing->2
GlobalOffensive->6
headphones->8
food->1
pcmasterrace->1
leagueoflegends->4
malefashionadvice->4
DotA2->3
Music->2
OpTicGaming->10
leakthreads->2
AskReddit->1
todayilearned->1
Games->1
So now we have some information about a random user and can for example make a histogram for a more presentable form. Here are the the top 3 subreddits where he/she is commenting.
Starting with Statistics
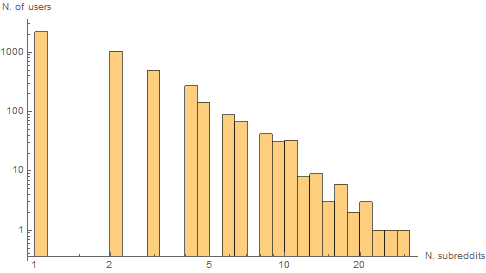
Now we can gather statistics about more than one user, for example the first 10,000 users in the database. To reduce the noise in the data, we filter them by quantity of comments and take all users that have more than 20 comments in some subreddits.
minLength=20;
commentPerSub=Map[Select[GroupBy[#,First->Last,Length],#>minLength&]&, data];

Short[commentPerSub,2]
<|rx109-><|newsokur->222,BakaNewsJP->37|>,WyaOfWade-><|nba->306,CoDCompetitive->32|>,
   Wicked_Truth-><|politics->156|>,jesse9o3-><|AskReddit->54,worldnews->275,soccer->28|>,
   <<7516>>,Zandock-><|fireemblem->57|>,RandomRem-><||>,Op69dong-><||>|>
This way we find ourseves with 4468 users. Here is the distribution of the amount of subreddits each user commented in. Most users only have significant activity (more than 20 comments) in one subreddit.
Subreddit analysis
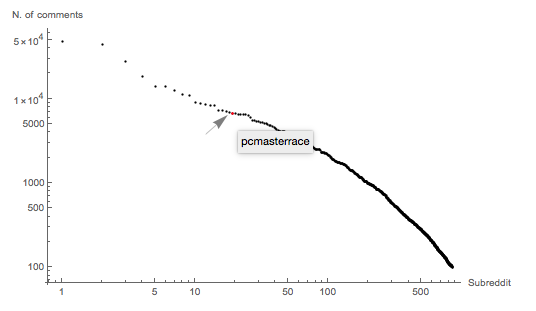
It's time to start the Subreddit analysis. I first got the list of all subs (1812 of them are present in my data).
allSubs = Merge[Values[commentPerSub], Total];

Length[allSubs]
1812
Here are the first five by number of comments
TakeLargest[allSubs, 5]
<|"AskReddit" -> 85288, "nba" -> 48097, "nfl" -> 43888,
 "leagueoflegends" -> 27483, "hockey" -> 18535|>
We can see that AskReddit is very popular sub so user commenting on it are probably not very correlated by interestsTherefore I decided to drop it from the list. Now I can have a look at the plot of each subreddit vs its number of comments.
User representation
Now I have enough information about subreddits and users for creating user vectors which we will use in user's classification.So let's create an empty user vector with zero comments for each sub, then replace the values for each user into empty vector.The new association as values for each subreddit.
(*Create an empty user vector with zero comments for each sub*)
userVectorEmpty = Association[Thread[Keys[allSubs] -> 0]];

Short[userVectorEmpty]
<|newsokur->0,BakaNewsJP->0,nba->0,<<1806>>,shorthairedhotties->0,uwaterloo->0|>

(*Replace values for each user into the empty vector*)
extendedCommentPerSub = Join[userVectorEmpty, #] & /@ Values[commentPerSub];
The new association as values for each subreddit
First[commentPerSub]
Short[First[extendedCommentPerSub]]
<|newsokur->222,BakaNewsJP->37|>
<|newsokur->222,BakaNewsJP->37,nba->0,<<1806>>,shorthairedhotties->0,uwaterloo->0|>

(*Create an empty user vector with zero comments for each sub and remove the \
subreddit names*)
userVectors = Values[Join[userVectorEmpty, #]] & /@ commentPerSub;
(*save the name of the users*)
userNames = Keys[userVectors];
(*remove also the keys with the users, now userVectors is just a normal \
matrix*)
userVectors = Values[userVectors];
(*normalize each vector user by dividing for the total number of comments per \
subreddit*)
userVectors = Transpose[Transpose[userVectors]/Values[allSubs]];
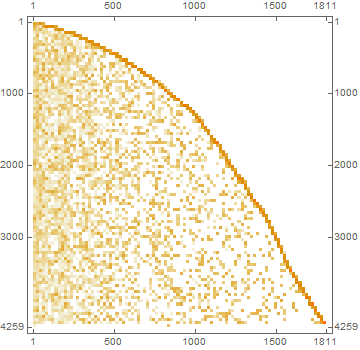
This is a plot of all the users vectors.
User classification
We want to build a similarity function to identify users with common interests
similarity[v1_,v2_]:=v1.v2/(Norm[v1]Norm[v2])
The norm at the denominator are computed separately for efficiency
norms=Norm/@N[userVectors];
normMatrix=Transpose[{norms}].{norms};
This builds the similarity matrix
similarityMatrix=N[userVectors].Transpose[N[userVectors]]/normMatrix;
I want all the values below a certain threshold to be zero. I.e. no connection between the users. I also subtract the diagonal not to connect users with themselves
similarityThreshold=.75;
m2=Threshold[similarityMatrix-IdentityMatrix[Length[userVectors]],similarityThreshold];
All the rest is set to one
m3=Ceiling[m2];
Now the graph is build from the adjacency matrix
AdjacencyGraph[m3]
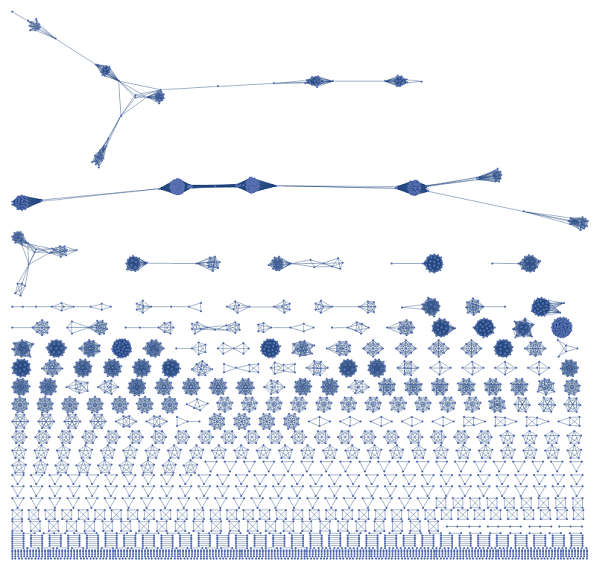
In this graph there are 1625 disconnected components
graphComponents=ConnectedGraphComponents[fullGraph];
Length[graphComponents]
1625
If I remove the components with only one element (i. e. the cluster of only one user) I am down to 592
graphComponents=Select[graphComponents,VertexCount[#]>1&];
Length[graphComponents]
592
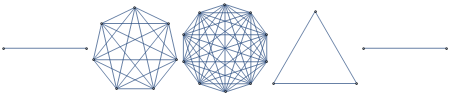
Each disconnected component represent now a group of users with similar commenting patterns---and hopefully similar interests. Here are five of them
Grid[{#,commentPerSub[[VertexList[#]]]}&/@RandomSample[graphComponents,5]]
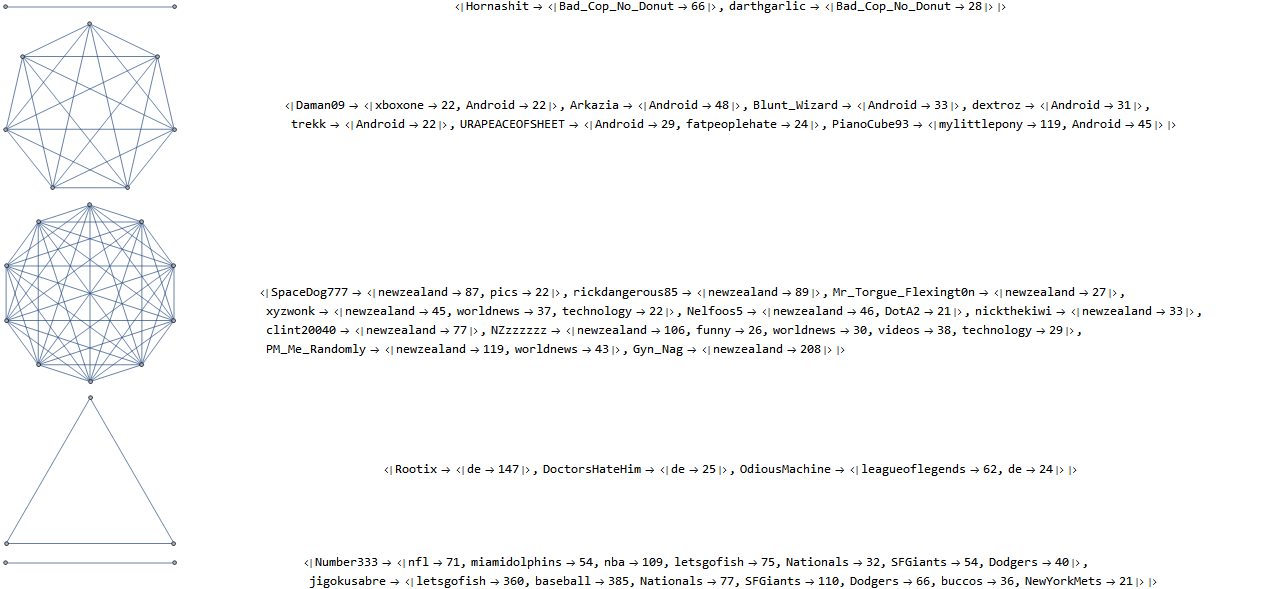
As we can see all these group of users have high activity on the same Subreddits.
 Attachments:


