Message Boards Message Boards

0
|
6280 Views
|
2 Replies
|
2 Total Likes
View groups...
Share
Share this post:

Ability to see direction of Parametric Curves when plotted?

Posted 8 years ago

Hello, all!

I have not been able to find any documentation on the docs for a way to see on the direction a single parameter curve has on a certain interval. I have seen many plots that were created using mathematica which led me to believe that I can - at the very least - determine the direction by seeing labeled points, let's say 't', on my plot. My question is, is there a known method that I may use to determine the direction of a parametric curve?

I have been using ParametricPlot]. The [docs for it hasn't provided any hint of this type of feature. Where should I look to read up on a feature similar to what I have described wanting?

POSTED BY: Alex Flores
2 Replies
Posted 8 years ago

+1

Thanks, mate!

This is exactly what I have been looking for!

POSTED BY: Alex Flores

From this site:

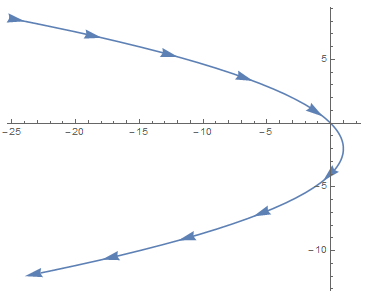
  eqs = {x == 1 - t^2, y == -2 t - 2};
  eq2 = {x, y} /. (And @@ eqs // ToRules)
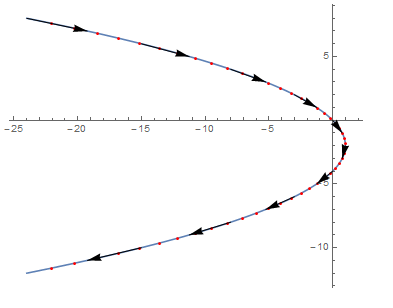
  ParametricPlot[eq2, {t, -5, 5}, MeshStyle -> Red, Mesh -> True, Epilog -> Arrow@Partition[Table[eq2, {t, -5, 5, 0.5}], 2]]

enter image description here

Or, from:

   ParametricPlot[eq2, {t, -5, 5}] /. Line[x_] :> Sequence[Arrowheads[Table[.05, {10}]], Arrow@Line[x]] 

enter image description here

POSTED BY: Mariusz Iwaniuk
Reply to this discussion
Community posts can be styled and formatted using the Markdown syntax.
Reply Preview
Attachments
Remove
or Discard

Group Abstract Group Abstract