In Mathematica the closest thing (currently) to a peak detect function is a function called MaxDetect, which is unfortunately very slow with large datasets and could be better at finding peaks. So (for a project which I will post here soon) I decided to write my own peak detection function.
I found a nice article from National Instruments here:
http://www.ni.com/white-paper/5432/en/I have subsequently implemented this in Mathematica.
So the basic idea behind this algorithm is whenever the detail wavelet passes zero, there is a peak. Let me explain this:
(I am assuming that you understand the basic concept of wavelets)
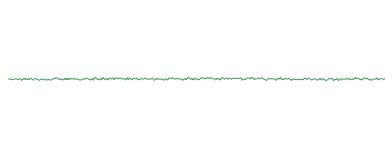
When you get the wavelet of a 1-dimensional object, you will get the approximation coefficients, and the detail coefficients. As their names suggest the approximation coefficients are the basic shape of the thing (used for noise reduction) while the detail coefficients are used for the little bumps and valleys that texture the original wave.
For example
Here is some noisy data:
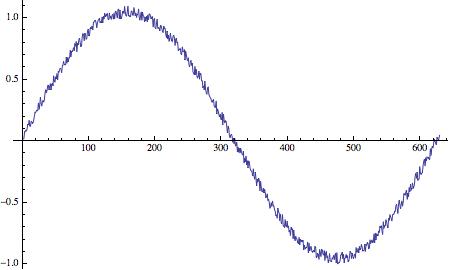
Approximate:
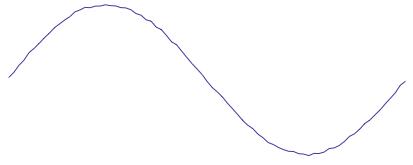
Detail:
So to access the detail vs approx wavelets from some wavelet data like this:
data = Table[Sin[x] + RandomReal[{0, .1}], {x, 0, 2 Pi, .01}];
dwd = DiscreteWaveletTransform[data, HaarWavelet[], 3]
So I am running a wavelet transform of data with a haar wavelet for 3 layers.
I can see the various coefficients like this:
dwd["ListPlot"]
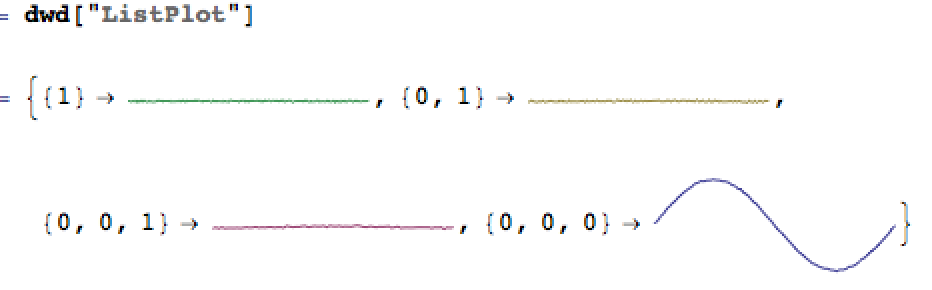
The coefficients that end in 1 are detail wavelets while those which end in 0 are approx wavelets.
(There is a {0} and a {0,0} wavelet but it doesn't show them).
The deeper you go into these coefficients the less wavelets are used to construct the wave and therefor they are more basic.
In this case we want the highest quality data so we can just look at level 1. (So the coefficient named "{1}").
So time to get down to the real code.
Here is some example data, in this case a fourier transform.
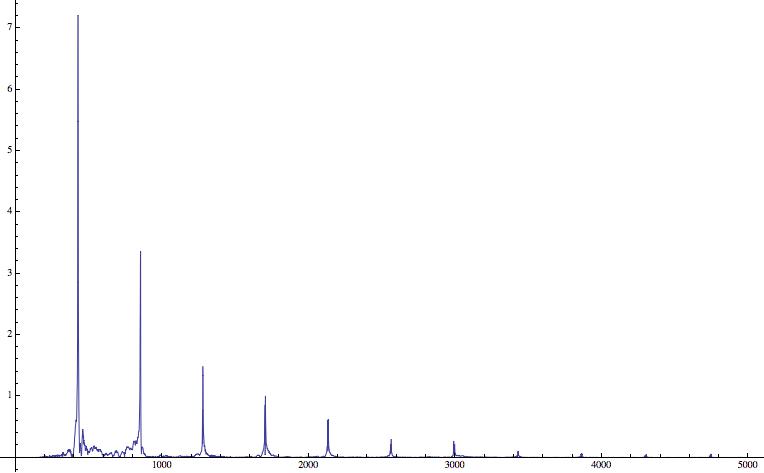
This is a fairly easy case but you can see that the number of datapoints is giant and there is some noise toward the bottom.
So the first thing we need to do is get rid of all the little peaks we don't care about.
Here "data" is the data with peaks in it and "min" is the minimum size of the peaks that will be detected.
dwd=DiscreteWaveletTransform[If[# < min, 0, #] & /@ data, HaarWavelet[],
1];
In this case I have set "min" to 1.
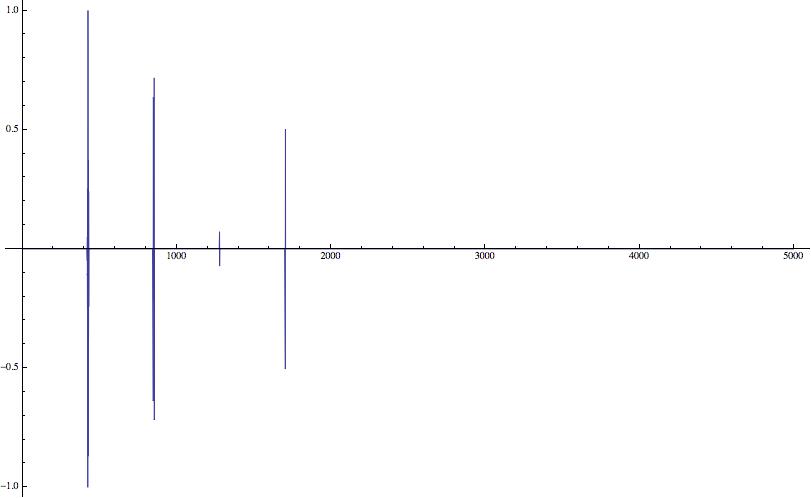
We can now run the inverse wavelet transform of that for the first detail coefficient:
InverseWaveletTransform[dwd, HaarWavelet[], {1}]
Which looks like this:
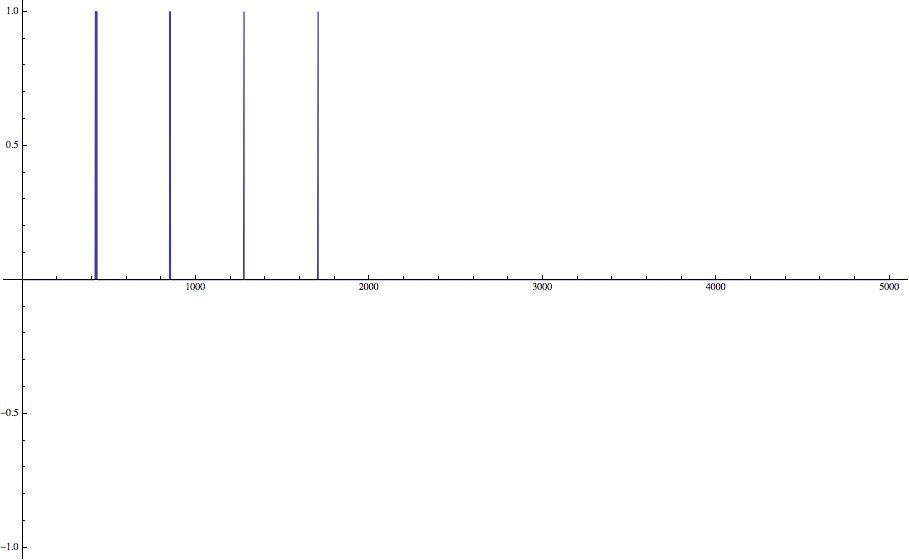
Now we detect every time those peaks cross zero. You may also notice that there is another threshold here which I found to be useful.
Normal[CrossingDetect[
If[Abs[#] < ther, 0, #] & /@
InverseWaveletTransform[
DiscreteWaveletTransform[If[# < min, 0, #] & /@ data,
HaarWavelet[], 1], HaarWavelet[], {1}]]]
This gets the position of the points in each peak:
Flatten[Position[
Normal[CrossingDetect[
If[Abs[#] < ther, 0, #] & /@
InverseWaveletTransform[
DiscreteWaveletTransform[If[# < min, 0, #] & /@ data,
HaarWavelet[], 1], HaarWavelet[], {1}]]]
, 1]]
We then split them into groups for each peak:
Split[Flatten[
Position[Normal[
CrossingDetect[
If[Abs[#] < ther, 0, #] & /@
InverseWaveletTransform[
DiscreteWaveletTransform[If[# < min, 0, #] & /@ data,
HaarWavelet[], 1], HaarWavelet[], {1}]]], 1]],
Abs[#1 - #2] < cther &]
"cther" is the distance 2 points have to be appart before they are counted as sepperate peaks. In this case I use 50 because I don't want it detecting false peaks right next to the real ones. But you could set it to split after every run of consecutive 1s.
After this it is pretty technical and so I present (drumroll) the final function!!!
FindPeaks[data_, ther_: .2, min_: 0, cther_: 50] :=
Function[peaks,
Transpose[{peaks,
data[[peaks]]}]][(#[[Ordering[data[[#]], -1][[1]]]] & /@
Split[Flatten[
Position[
Normal[CrossingDetect[
If[Abs[#] < ther, 0, #] & /@
InverseWaveletTransform[
DiscreteWaveletTransform[If[# < min, 0, #] & /@ data,
HaarWavelet[], 1], HaarWavelet[], {1}]]], 1]],
Abs[#1 - #2] < cther &])]
So here is it working on the fourier transform!
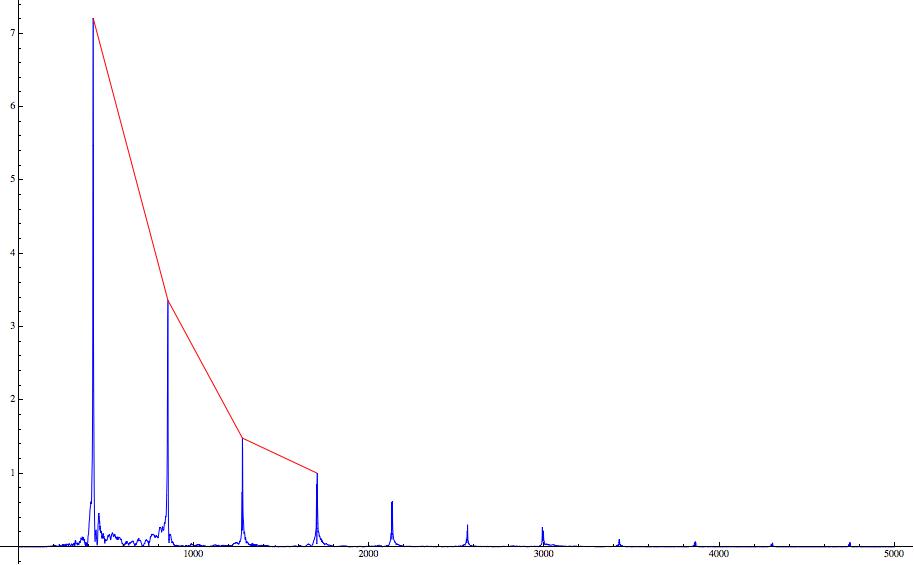
The blue is the unmodified data and the red is a line from peak to peak that fell within our requirments, but with different settings we could get all of these smaller peaks off to the right.
Well that's all I got so if you have any questions about the code or edits that make it better, post it here!


