Hi,
something like this?
subdivisions = #["Subdivisions"] & /@ Entity["Country", "UnitedStates"]["AdministrativeDivisions"];
countyData = {#, #["Population"], #[EntityProperty["AdministrativeDivision", "PerCapitaIncome"]], #[EntityProperty["AdministrativeDivision","BorderingCounties"]]} & /@ Flatten[subdivisions];
GeoRegionValuePlot[Rule @@@ Transpose[{countyData[[All, 1]], countyData[[All, 2]]}], ImageSize -> 1000, ColorFunction -> (ColorData["Rainbow"][#^.2] &), GeoRange -> Entity["Country", "UnitedStates"]]
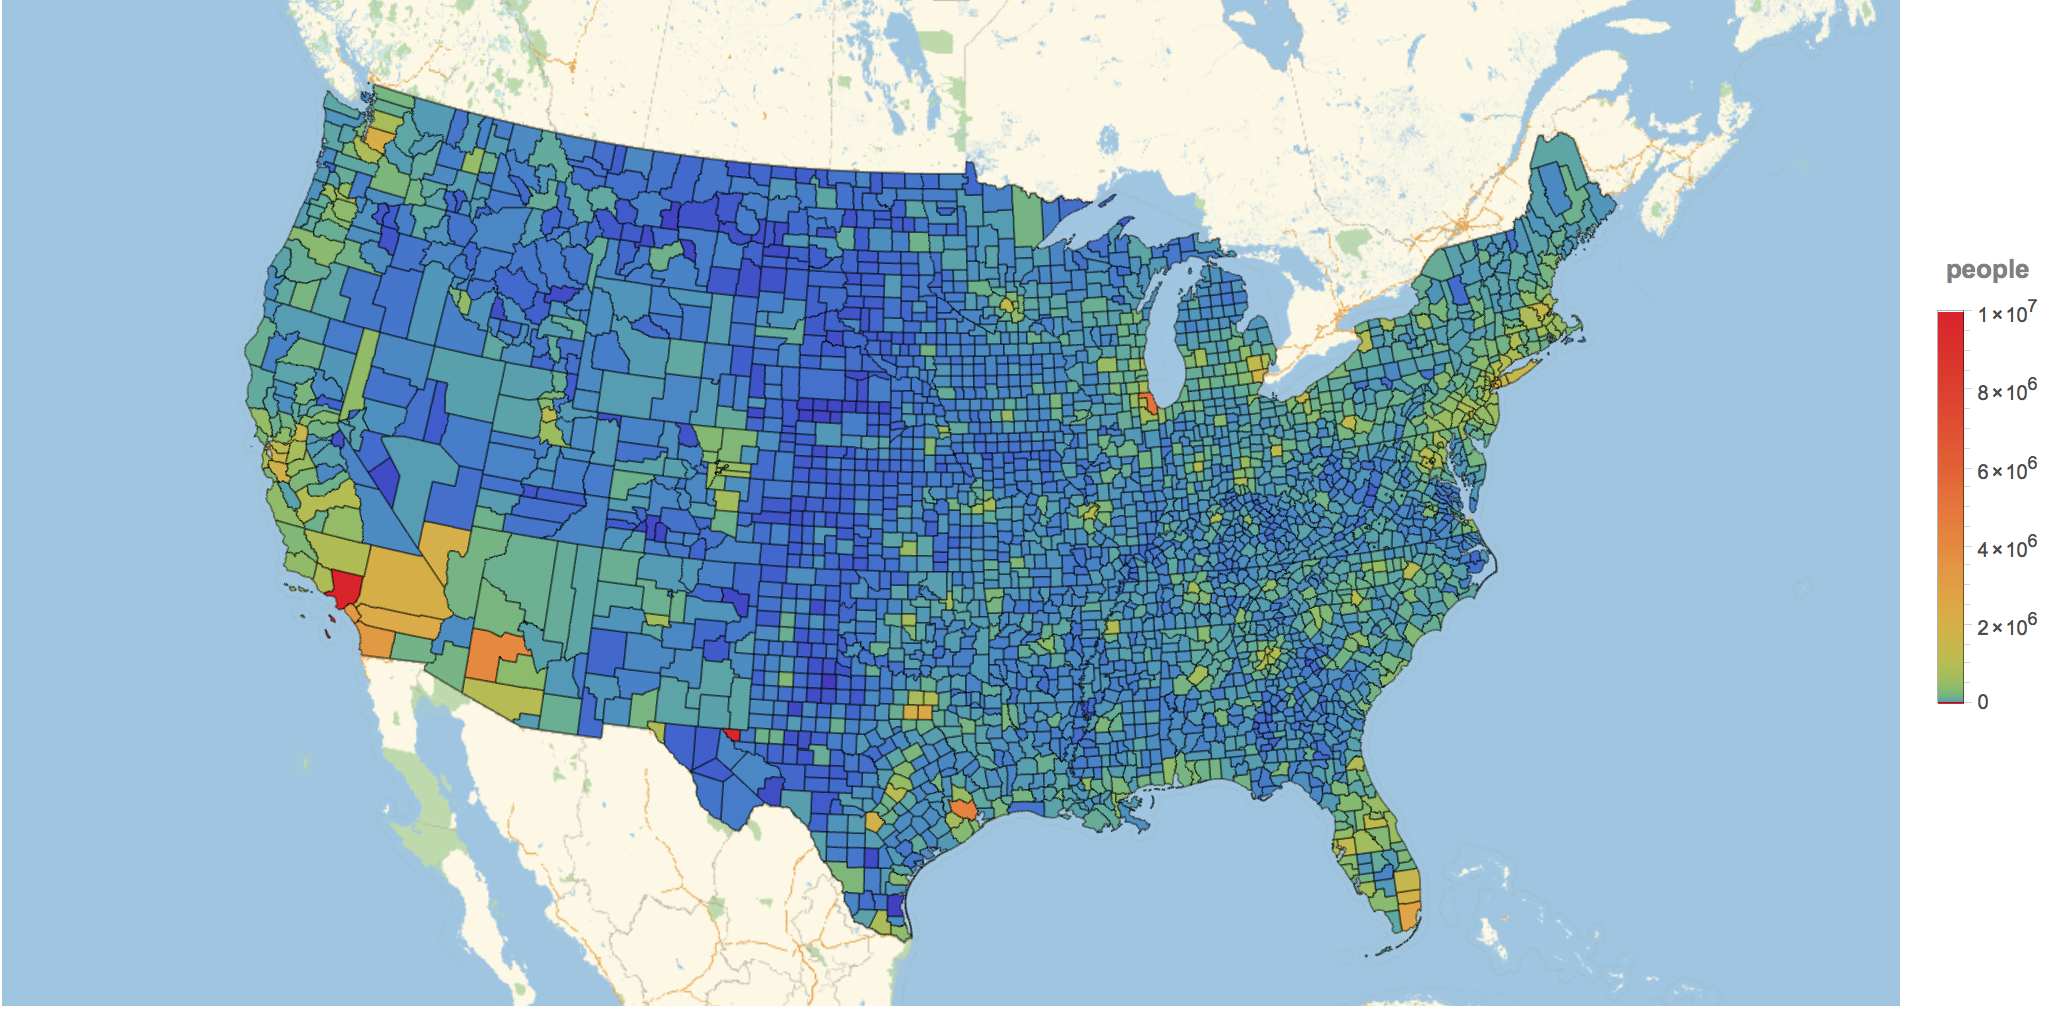
This takes a while to evaluate.
Cheers,
Marco
PS: I took it from one of my other posts, so it also collected data on income etc. Should be possible to adapt to Australia, too.


