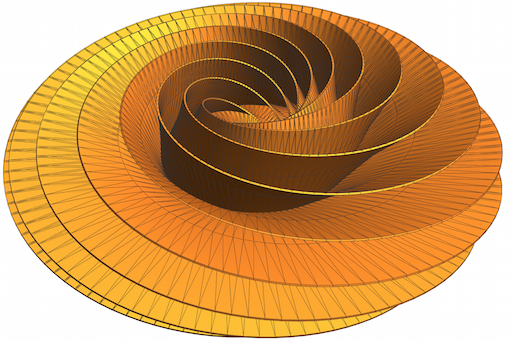
You can choose to sample many points as t varies and few points as u varies. Choosing PlotPoints -> {2000, 3} gives good detail:
r = 7; R = 19;
ParametricPlot3D[{{(u^Cos[(r t)/R]) Cos[t], (u^Cos[(r t)/R]) Sin[t], (-Log[u] Sin[(r t)/R])}},
  {t, 0, 2 R Pi}, {u, 1, E}, MaxRecursion -> 0, Mesh -> All, PlotPoints -> {2000, 3}, PlotStyle -> Thickness[0.02]]
There are roughly 24000 triangles in this plot:
MeshCellCount[DiscretizeGraphics[%]]
(* {12000, 35994, 23996} *)


