Message Boards Message Boards

0
|
2175 Views
|
1 Reply
|
1 Total Likes
View groups...
Share
Share this post:

3D plot a linear function y=a*x for undefined constant "a"?

Posted 8 years ago

Hello! How can I get a 3D plot of the y=a*x function for every possible value of 'a', where 'a' is a real constant? Something like taking the 3D graphs of y=0.3x, y=x, y=2x, y=7x etc and adding them all together in one graph. Thank you

POSTED BY: Dora Crawley

Hi Dora,

I am quite sure that I misunderstand your question, because it looks to me as if you need:

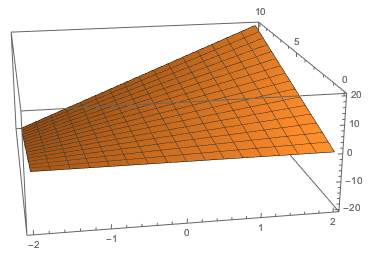
Plot3D[a x, {x, -2, 2}, {a, 0, 10}]

enter image description here

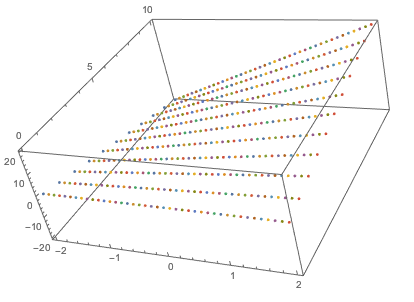
If you only want the points you could use

ListPointPlot3D[Table[{x, a, a x}, {x, -2, 2, 0.1}, {a, 0, 10, 1}]]

enter image description here

But all of this is very basic and is very well documented. So I suppose that your question has some gist that I don't get. Could you explain this in more detail, please?

Cheers,

Marco

POSTED BY: Marco Thiel
Reply to this discussion
Community posts can be styled and formatted using the Markdown syntax.
Reply Preview
Attachments
Remove
or Discard

Group Abstract Group Abstract