Message Boards Message Boards

Fitting Erlang (or Gamma) distribution problems?

Hi everybody,

I hope to receive help for my problem: I'm working with Mathematica 9 to fit some experimental data who has to reproduce an Erlang function. This last is implemented in the package, and I followed all the instructions to fit it with "NonlinearModelFit", but it seems to have some problem. It follow the code I used:

data = Import[
  "/Volumes/Archivio/Documenti/Tesi Magistrale/Delay \
simulator/Analisi Sensibilità/Prova/ErlangFunction.txt", "Table"]
nlm1 = NonlinearModelFit[data, (
  E^(-((k x)/d)) (d/k)^-k x^(-1 + k))/(k - 1)!, {{k, 4}, {d, 19} }, 
  x, ConfidenceLevel -> 95/100 , MaxIterations -> 100, 
  Method -> "LevenbergMarquardt"]
nlm1["BestFit"]
nlm1["BestFitParameters"]

And then the answers:

Out[125]= {{8, 9.22098}, {9, 12.603}, {10, 16.5616}, {11, 
  20.9952}, {12, 25.7512}, {13, 30.6382}, {14, 35.4415}, {15, 
  39.9425}, {16, 43.9366}, {17, 47.2498}, {18, 49.7508}, {19, 
  51.3581}, {20, 52.0423}, {21, 51.823}, {22, 50.763}, {23, 
  48.9592}, {24, 46.5319}, {25, 43.6152}, {26, 40.3468}, {27, 
  36.8598}, {28, 33.2766}, {29, 29.7039}, {30, 26.2307}, {31, 
  22.9267}, {32, 19.8431}, {33, 17.0138}, {34, 14.4576}, {35, 
  12.1801}, {36, 10.1771}, {37, 8.43647}}

During evaluation of In[125]:= NonlinearModelFit::cvmit: Failed to converge to the requested accuracy or precision within 100 iterations. >>

Out[127]= 5.25537186920*10^-285 E^(-16.1068 x) x^325.684

Out[128]= {k -> 326.684, d -> 20.2824}

There are no chances to fit this function, I tried to change accuracy, the number of iterations, and all the other options of NonlinearmodelFit. Between the various tests I noticed that the problem could be linked to the factorial term (k-1)!, because if I take off this, the situation improves.

My data are created from a real gamma with parameters alpha= k and beta=k/d with numerical value k=20 and d=35.

How can I to to obtain that?

Thank you everybody for the support,

Luca

POSTED BY: Luca Rossini
10 Replies

Thank you Jim, according to what you explained in your post, my experimental function seems to be traslated in relaction to the theoretical, and it suggests to traslate the time column in my data.

It could be a good way, I tried in in Mathematica, and seems to answer with k around 20, and d around 35.

POSTED BY: Luca Rossini
Posted 8 years ago

Thanks Claude and Luca. That clears things up. So the actual (continuous) time of an egg hatching is only recorded by day. That means, for example, the 8 eggs recorded on day 9 hatched sometime between day 8 and day 9. To account for the fact that you have "censored" data one needs to construct the likelihood (or the log likelihood) a bit different than what one would do if there were continuous measurements.

Also, Mathematica has a built-in Erlang distribution as Claude has shown. However, Mathematica uses a slightly different parameterization that you use. But the conversion is simple: to use Mathematica's built-in Erlang distribution you would use

ErlangDistribution[k,k/d]

To construct the likelihood function so that maximum likelihood estimates of $k$ and $d$ could be obtained, you would use the following:
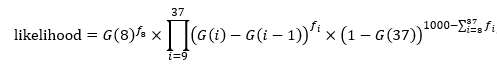
Likelihood function accounting for censoring

where $G(x)$ is the cumulative distribution function of the Erlang distribution and $f_i$ is the associated number of eggs counted on day $i$. The Mathematica code is

data = {{8, 9}, {9, 12}, {10, 16}, {11, 20}, {12, 25}, {13, 30}, {14, 35}, {15, 39}, {16, 43}, {17, 47},
{18, 49}, {19, 51}, {20, 52}, {21, 51}, {22, 50}, {23, 48}, {24, 46}, {25, 43}, {26, 40}, {27, 36}, {28, 33},
{29, 29}, {30, 26}, {31, 22}, {32, 19}, {33, 17}, {34, 14}, {35, 12}, {36, 10}, {37, 8}};
n = 1000;
count = data[[All, 2]];

logLikelihood = count[[1]] Log[CDF[ErlangDistribution[k, k/d], 8]] + 
  Sum[count[[i]] Log[(CDF[ErlangDistribution[k, k/d], i + 7] - CDF[ErlangDistribution[k, k/d], i + 6])], {i, 2, Length[data]}] +
  (n - Total[count]) Log[(1 - CDF[ErlangDistribution[k, k/d], 37])];

sol = NMaximize[{logLikelihood, d > 10 && k \[Element] Integers && k > 1}, {k, d}, MaxIterations -> 1000]
(* {-3308.429332485035`,{k -> 7,d -> 22.53458409510396}} *)

The maximum likelihood estimates do not match what you expect but let's plot the data and the fits with maximum likelihood estimates and the "expected" parameters.

Show[Plot[{PDF[ErlangDistribution[k, k/d] /. sol[[2]], x],
   PDF[ErlangDistribution[k, k/d] /. {k -> 20, d -> 35}, x]}, {x, 8, 37},
   PlotStyle -> {Blue, Red}, AxesOrigin -> {7, 0},
   PlotLegends -> {"k -> 7, d -> 22.5346", "k -> 20, d -> 35"}],
 ListPlot[Transpose[{data[[All, 1]], data[[All, 2]]/1000}]]]

Plot of data and fits

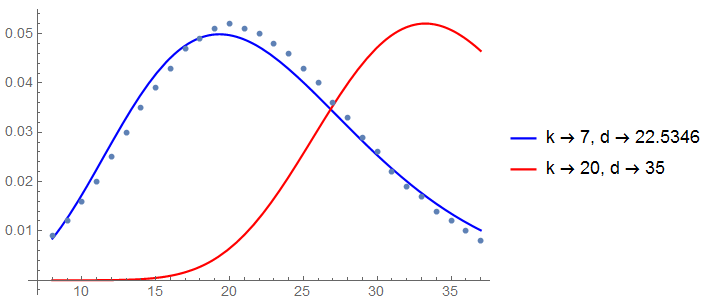
So I think we're closer but not quite there yet as this doesn't match with your expected values for $k$ and $d$.

POSTED BY: Jim Baldwin

I suppose each pair of numbers in data is: {time, number of death}? I considered two cases:

(1) the sample consist in : numbers of death

(2) the sample consist in : rate of death.

and this sample obeys an Erlang distribution (FdrDir is the empirical distribution function). None of the fits is perfect, but...

Claude

Attachments:
POSTED BY: Claude Mante

Thank You Claude, Each pair of data is {time; born}: if I consider a number of 1000 eggs laid in day 0, everyday I control if there are some hatching eggs, and I count it. For "born" I mean, according this experimental situation how many hatching eggs I register everyday, and this representation, should give an Erlang distribution. Parameter k is the number of substage not observable that every individual has to overtake to became a larva (hatching eggs), and d is the mean develop time for population. At this point, n, the constant considered by Jim, is the total number of individual who composed the initial cohort.

I hope to cleared the experimental situation now. I have built a model in excel who reproduces this real situation, not considering the mortality, and it seems to provides an Erlang, but I need to fit it to confront the parameter k and d (they must be equal if the numerical model run well).

According to my data, I have to obtain k=20 and d=35

POSTED BY: Luca Rossini
Posted 8 years ago

I'm still not clear on what your data actually represents as you have a continuous distribution but the data appears very discrete in both of the dimensions. And if the second values represent counts from a random sample, the resulting counts appear far too smooth for experimental data (even if sampled from a known distribution).

But putting those issues aside...you can't get a good fit from the function you list as that function is a probability density function with area integrating to 1.0 while your data has values that would essentially integrate to around 1,000. So because you say you don't have a random sample from an Erlang distribution and are simply performing a regression with a curve form that resembles the shape of an Erlang distribution, you need to include a multiplicative constant to get the height of the curve where you need it. Here is the Mathematica code to do so:

data = {{8, 9}, {9, 12}, {10, 16}, {11, 20}, {12, 25}, {13, 30}, {14, 
    35}, {15, 39}, {16, 43}, {17, 47}, {18, 49}, {19, 51}, {20, 
    52}, {21, 51}, {22, 50}, {23, 48}, {24, 46}, {25, 43}, {26, 
    40}, {27, 36}, {28, 33}, {29, 29}, {30, 26}, {31, 22}, {32, 
    19}, {33, 17}, {34, 14}, {35, 12}, {36, 10}, {37, 8}};
nlm = NonlinearModelFit[data, {c Exp[-k x/d] (d/k)^-k x^(-1 + k)/(k - 1)!, 
    c > 0 && k > 1 && d > 0}, {{c, 1000}, {k, 10}, d}, x];
nlm["BestFitParameters"]
(* {c -> 984.9972092979393`,k -> 7.861851974146133`,d -> 22.642854391845365`} *)
Show[ListPlot[data], Plot[nlm[x], {x, 8, 37}]]

Erlang fit

If the theory you mention suggests or requires an Erlang distribution, I would have to believe that the probabilistic properties of that distribution are an essential feature. But in this example none of the probabilistic properties are even considered. Just the shape. So, in short, I'm still confused.

POSTED BY: Jim Baldwin

What you say is partially true: my Erlang have an integer N=1000 who represent the initial cohort entering in the process. At time 0 a cohort composed from N=1000 individuals enter in the process, and then exit distributed as an Erlang function. N could be another parameter, but according to this question, I can divide for 1000 the fitting function, solving (partially) the problem.

But there are still some questions open: if I "normalize" the fitting function dividing for 1000, I should obtain my original parameter k=20 and d=35, but it seems to not happen, why?

Thank you really for your help!

POSTED BY: Luca Rossini
Posted 8 years ago

You should follow Claude Mante's advice. If you really have random samples from a probability distribution, then you should not be using NonlinearModelFit. If, however, you have a curve that resembles a probability density function, then NonlinearModelFit is likely appropriate. Do you have pairs of data points or a vector of observations? Sharing some of your data would clear this up.

The error you mention likely results from negative values (which means you don't have random samples from a gamma distribution).

POSTED BY: Jim Baldwin

Thank you Claude Mante and Jim Baldwind for your interest. Before i firget to insert the .txt with data that I'm using for the fit. It represents data from a cohort who develop itself in time (insects/day), and theoretically they have to represent an Erlang distribution (or Gamma, the problem is similar). When I tried to analyze experimental data, I noticed this error in Mathematica, and first to proceed I investigated the problem. To understand if my experimental data had something wrong, I built with excel two columns x, f(x) who represents the coordinates of an Erlang distribution, of which I know parameters. If mathematica works well, with NonlinearModelFit I have to obtain back initial parameters.

According this theory, I have a curve that resembles a probability density function, and not a random samples of a probability distribution. I hope that .txt can help you to understand the problem. Thank you everybody for the interest and to help me

data = {{8, 9}, {9, 12}, {10, 16}, {11, 20}, {12, 25}, {13, 30}, {14, 35}, \
{15, 39}, {16, 43}, {17, 47}, {18, 49}, {19, 51}, {20, 52}, {21, 51}, \
{22, 50}, {23, 48}, {24, 46}, {25, 43}, {26, 40}, {27, 36}, {28, 33}, \
{29, 29}, {30, 26}, {31, 22}, {32, 19}, {33, 17}, {34, 14}, {35, 12}, \
{36, 10}, {37, 8}}
Attachments:
POSTED BY: Luca Rossini

I think you should simply use the available ML procedure:

{a, b} /. FindDistributionParameters[data, GammaDistribution[a, b]]

POSTED BY: Claude Mante

It doesn't work, this is the answer:

FindDistributionParameters::ntsprt: One or more data points are not in support of the process or distribution GammaDistribution[k,a]. >>

In my NonlinearModelFit code, is there any error? I don't know what is happening

POSTED BY: Luca Rossini
Reply to this discussion
Community posts can be styled and formatted using the Markdown syntax.
Reply Preview
Attachments
Remove
or Discard

Group Abstract Group Abstract