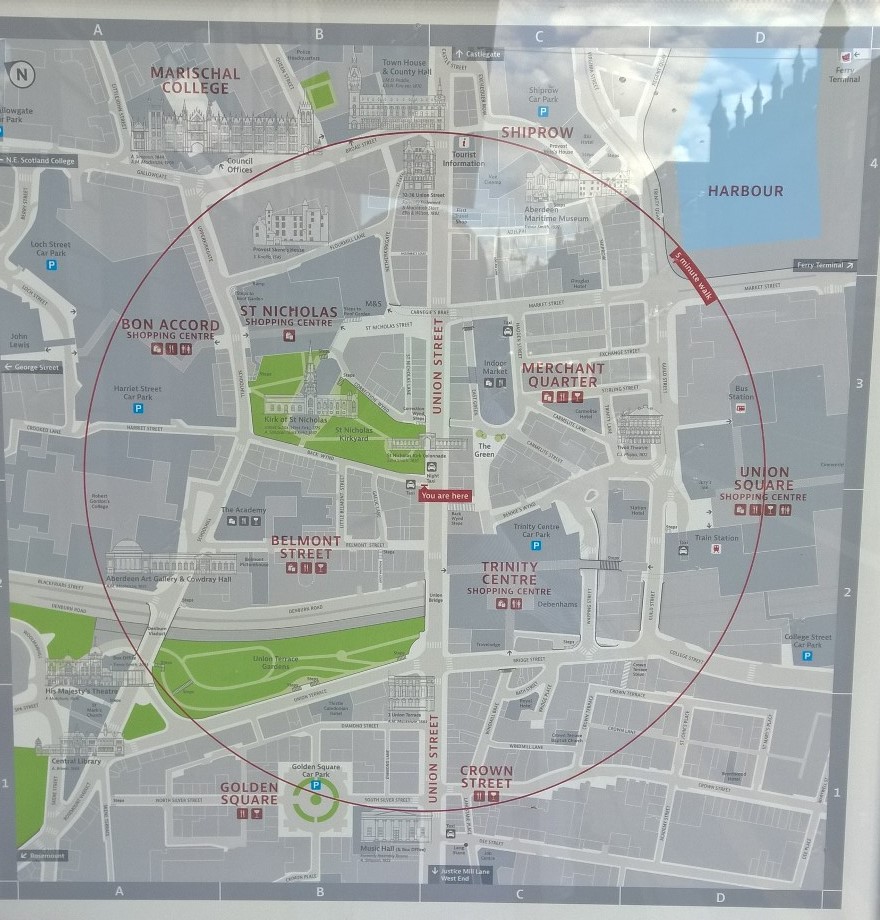
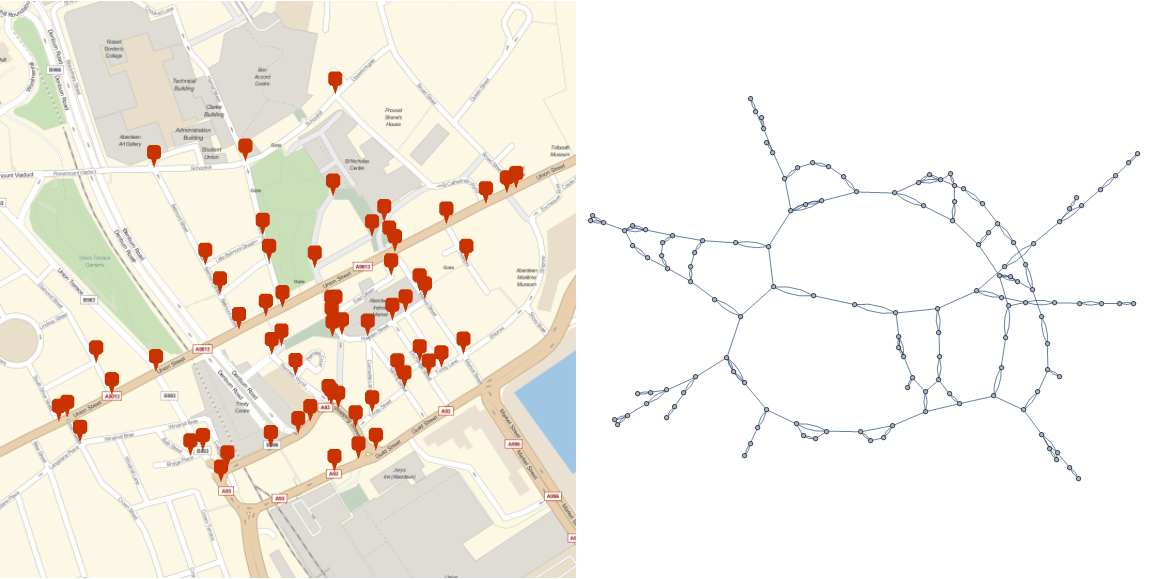
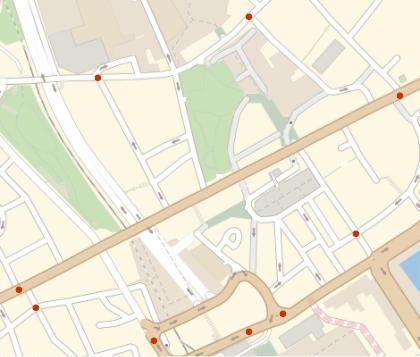
Offering quick and intuitive information at a glance, maps like these can be really useful when visiting a city since its usually easier to appreciate a 5 minute walk rather than a distance of 350 m or so. These maps have recently appeared in Aberdeen's city centre and seeing one in a familiar setting made me wonder what the map would look like if the 5 minute walk radius was based not on displacement but on distance actually walked along all possible paths.
Obtaining Data
OpenStreetMap is a project aimed to generate an open source map of the entire world. Its comparable to Google maps in scope and function but OSM has the advantage that it's map data can be easily exported in XML format.
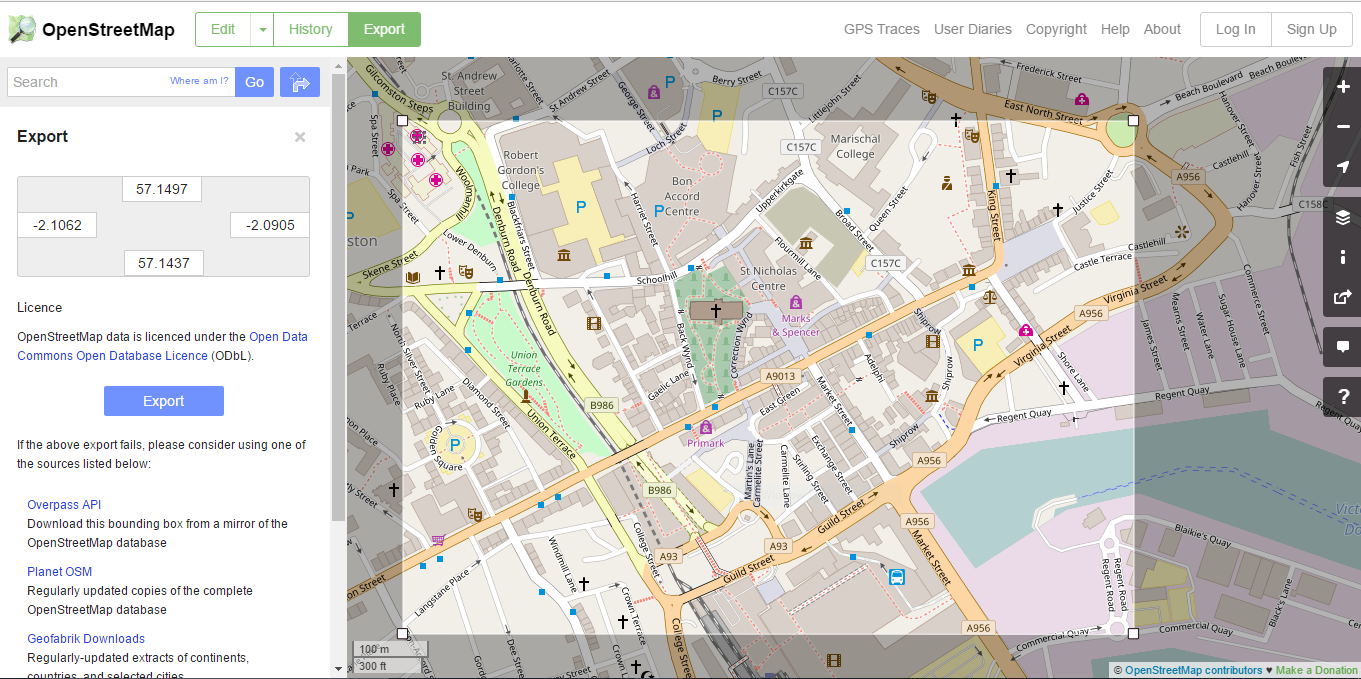
https://www.openstreetmap.org/export#map=16/57.1468/-2.0965
The entire visible map area or a manual selection (above) can be exported.
There's a good example of working with OSM data in Mathematica in this community post and served as a starting point for making sense of the imported data. Here, the aim for now is to generate a graph of all paths in the map extract.
The downloaded map file was imported into Mathematica, specifying it as XML.
mapFile =
  Import[FileNameJoin[{NotebookDirectory[], "AberdeenData",
     "mapAberdeen.osm"}], "XML"];
OSM data is characterised by three types: nodes, ways and tags. 'ways' are used to define paths in the map and can contain additional information specifying their type (road, pedestrian zone etc) and behaviours (speed limit, one way etc). We generate a list of 'ways' via
In[1570]:= wayList = Cases[mapFile, XMLElement["way", _, _], Infinity];
In[1571]:= wayList[[1]]
Out[1571]= XMLElement["way", {"id" -> "4259736", "visible" -> "true",
"version" -> "5", "changeset" -> "23168625",
"timestamp" -> "2014-06-26T01:18:21Z", "user" -> "neiljp",
"uid" -> "605122"}, {XMLElement["nd", {"ref" -> "25534514"}, {}],
XMLElement["nd", {"ref" -> "25534517"}, {}],
XMLElement["tag", {"k" -> "highway", "v" -> "unclassified"}, {}],
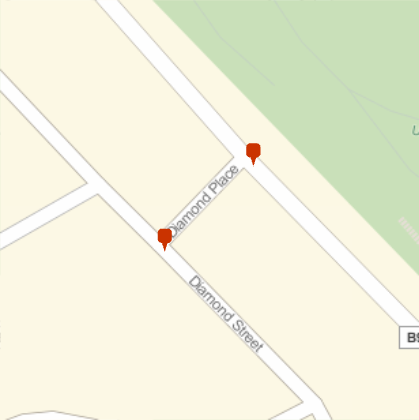
XMLElement["tag", {"k" -> "name", "v" -> "Diamond Place"}, {}],
XMLElement["tag", {"k" -> "oneway", "v" -> "yes"}, {}],
XMLElement[
"tag", {"k" -> "source:oneway",
"v" -> "survey [no-entry signs]"}, {}]}]
Now we extract the nodes
In[1573]:=
getElementNodeID =
  Function[{elem},
   Cases[elem, XMLElement["nd", {"ref" -> nodeID_}, {}] -> nodeID,
    Infinity]];

getElementNodeID[wayList[[1]]]

Out[1574]= {"25534514", "25534517"}
We generate a list of nodes; nodes have unique ID's and correspond to a lat/lon geoposition.
In[1575]:=
nodeList = Cases[mapFile, XMLElement["node", _, _], Infinity];

nodeList[[1]]

Out[1576]= XMLElement["node", {"id" -> "17420455",
  "visible" -> "true", "version" -> "9", "changeset" -> "9364790",
  "timestamp" -> "2011-09-21T22:49:52Z", "user" -> "benwatt",
  "uid" -> "92905", "lat" -> "57.1465712", "lon" -> "-2.0891077"}, {}]
Taking the nodes from the wayList example above, we can now obtain the geolocations of the road "Diamond Place".
In[1591]:=
getNodeGeoPosition =
  Function[{nodeElem},
   Cases[nodeElem, {__, "lat" -> lat_, "lon" -> lon_} -> {lat, lon},
    Infinity]];

searchElementsByNode =
  Function[{nodeID},
   Cases[nodeList, XMLElement["node", {"id" -> nodeID, __}, {}],
    Infinity]];

p = Flatten[
  getNodeGeoPosition /@
   searchElementsByNode /@ getElementNodeID[wayList[[1]]]
  , 1]

Out[1593]= {{"57.1465712", "-2.1046173"}, {"57.1467539", "-2.1042681"}}
And check the results
GeoGraphics[
 GeoMarker[ToExpression /@ p],
 GeoRange -> Quantity[50, "Meters"]
 ]
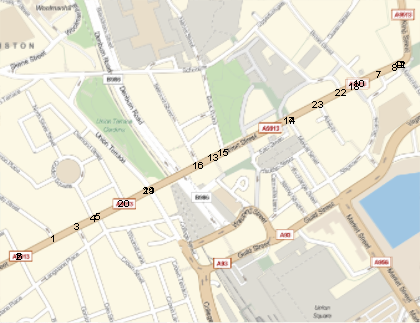
The nodes of a path don't only define its shape but also mark the points of intersection with other paths. These such intersecting nodes are shared by the intersecting paths so are present in each XML object for each path. Thus searching for shared nodes will help generate a list of connected streets.
In[1602]:=
searchElementsByStreet =
Function[{name},
Part[wayList, (First /@
Position[wayList,
XMLElement["tag", {"k" -> "name", "v" -> name}, {}],
Infinity])]];
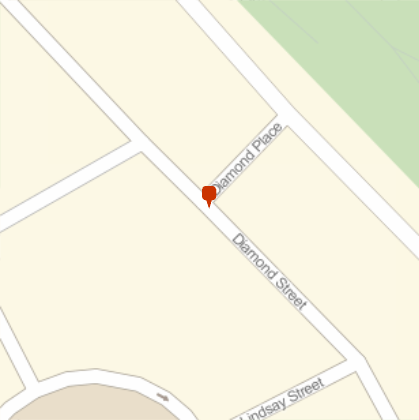
searchElementsByStreet["Diamond Street"]
Out[1603]= {XMLElement[
"way", {"id" -> "4259730", "visible" -> "true", "version" -> "3",
"changeset" -> "37965704", "timestamp" -> "2016-03-20T23:04:26Z",
"user" -> "neiljp",
"uid" -> "605122"}, {XMLElement["nd", {"ref" -> "25534508"}, {}],
XMLElement["nd", {"ref" -> "25534512"}, {}],
XMLElement["nd", {"ref" -> "25534513"}, {}],
XMLElement["nd", {"ref" -> "4070626753"}, {}],
XMLElement["nd", {"ref" -> "25534514"}, {}],
XMLElement["nd", {"ref" -> "25534525"}, {}],
XMLElement["nd", {"ref" -> "25534515"}, {}],
XMLElement["nd", {"ref" -> "25534516"}, {}],
XMLElement["tag", {"k" -> "highway", "v" -> "unclassified"}, {}],
XMLElement["tag", {"k" -> "name", "v" -> "Diamond Street"}, {}]}]}
In[1607]:= q = Flatten[
getNodeGeoPosition /@
searchElementsByNode /@
getElementNodeID[searchElementsByStreet["Diamond Street"]]
, 1]
Out[1607]= {{"57.1453424", "-2.1031396"}, {"57.1456877",
"-2.1034541"}, {"57.1462179", "-2.1040048"}, {"57.1462564",
"-2.1040545"}, {"57.1465712", "-2.1046173"}, {"57.1466820",
"-2.1048480"}, {"57.1471452", "-2.1056991"}, {"57.1470345",
"-2.1061097"}}
Flatten[Intersection[p, q], 1]
Out[1609]= {"57.1465712", "-2.1046173"}
In[1610]:= GeoGraphics[
GeoMarker[ToExpression /@ Flatten[Intersection[p, q], 1]],
GeoRange -> Quantity[50, "Meters"]
]
Processing Data - Generating a Graph
With the data's structure figured out and an approach to finding connectivity of paths determined, its time to scale up and process the map file.
To make the development phase a little easier, I transformed the XML data I needed into native Mathematica associations.
transformWayElement = Function[{wayEntity},
   Join[
    Association[
     "nodeRef" ->
      Values[Flatten[
        Cases[#, {"ref" -> __}] & /@
         Cases[wayEntity, XMLElement["nd", _, _], Infinity]]]],
    Association[(#[[1]] -> #[[2]]) & /@
      Partition[
       Values[Flatten[
         Cases[#, {"k" -> _, "v" -> _}] & /@
          Cases[wayEntity, XMLElement["tag", _, _], Infinity]]], 2]]
    ]
   ];

Monitor[Block[{datasetTemp},
   datasetTemp = Reap[
     Do[
      Sow[transformWayElement[wayList[[i]]]],
      {i, Length[wayList]}
      ]];
   Export["mapDataset.mx", Flatten[Last[datasetTemp]]];
   ], ProgressIndicator[i, {1, Length[wayList]}]];

dataset = Import["mapDataset.mx"];

Block[{nodeDataTemp},
  Monitor[
   nodeDataTemp = Reap[
     Do[
      Sow[
       Cases[
          nodeList[[i]],
          {"id" -> id_, __} -> id, Infinity][[1]] ->
        Flatten[Cases[
          nodeList[[i]],
          {__, "lat" -> lat_, "lon" -> lon_} -> {lat, lon}, Infinity]]

       ], {i, Length[nodeList]}
      ]
     ];
   Export["nodeData.mx", Association[Flatten[nodeDataTemp[[2]]]]]
   , ProgressIndicator[i, {1, Length[nodeList]}]]
  ];

nodeData = Import["nodeData.mx"];


In[20]:= dataset[[1]]

Out[20]= <|"nodeRef" -> {"25534514", "25534517"},
"highway" -> "unclassified", "name" -> "Diamond Place",
"oneway" -> "yes", "source:oneway" -> "survey [no-entry signs]"|>

In[27]:= nodeData[[1 ;; 5]]

Out[27]= <|"17420455" -> {"57.1465712", "-2.0891077"},
"17420464" -> {"57.1481194", "-2.0908419"},
"25534513" -> {"57.1462179", "-2.1040048"},
"25534511" -> {"57.1435048", "-2.1097332"},
"25534519" -> {"57.1477191", "-2.1059048"}|>
We also redefine
getNodeGeoPosition = Function[{nodeID},
   GeoPosition[ToExpression /@ Lookup[nodeData, nodeID], "WGS84"]
   ];
Search for intersecting nodes
intersectionStreets = Function[{rootObj},
   Monitor[
    Reap[
     Do[
      If[Length[
         Intersection[rootObj["nodeRef"],
          Flatten[#["nodeRef"] & /@
            searchByName[streetNames[[i]], dataset]]]] > 0, Sow[i]],
      {i, Length[streetNames]}
      ]
     ], ProgressIndicator[i, {1, Length[streetNames]}]
    ]
   ];

In[36]:= Flatten[Last[
  intersectionStreets[
   searchByName["Diamond Place", dataset][[1]]
   ]
  ]]

Out[36]= {1, 41, 49, 188}

In[45]:= streetNames[[1]]
streetNames[[41]]
streetNames[[49]]
streetNames[[188]]

Out[45]= "Diamond Place"

Out[46]= "Union Terrace"

Out[47]= "Diamond Street"

Out[48]= "Union Terrace"
Then connect to form graph components
generateGraph = Function[{
    rootObj
    },
   With[{
     q = Catenate[
       searchByName[streetNames[[#]], dataset] & /@
        Flatten[Last[intersectionStreets[rootObj]]]],
     rootObjName = rootObj["name"]
     },
    Monitor[
     Reap[
      Do[
       With[{
         nodeIntersection = Intersection[
           rootObj["nodeRef"],
           q[[i]]["nodeRef"]
           ]
         },
        If[
         q[[i]]["name"] != rootObjName,
         If[Length[nodeIntersection] > 0,
          Sow[Flatten@{
             rootObjName <> "_" <> ToString[nodeIntersection[[1]]] <->
              q[[i]]["name"] <> "_" <> ToString[nodeIntersection[[1]]],
             (******)
             nodeIntersection
             (*******)
             }]]
         ]
        ],
       {i, 1, Length[q]}
       ]
      ], ProgressIndicator[i, {1, Length[q]}]
     ]
    ]
   ];

In[59]:= DeleteDuplicates[First /@ Flatten[Last[
    generateGraph[searchByName["Diamond Place", dataset][[1]]]
    ], 1]]

Out[59]= {"Diamond Place_25534517" <-> "Union Terrace_25534517",
 "Diamond Place_25534514" <-> "Diamond Street_25534514"}
Another example
(* for *)
streetNames[[4]]

Out[60]= "Union Street"

In[61]:= (* find points of intersection  *)
routeStreet[streetNames[[4]]]

In[62]:= (* intersections form graph edges *)
q = DeleteDuplicates[Flatten[graphData, 1]]

Out[62]= {{"Union Street_25534510" <-> "Huntly Street_25534510",
  "25534510"}, {"Union Street_42522651" <-> "Union Row_42522651",
  "42522651"}, {"Union Street_61151184" <-> "Dee Street_61151184",
  "61151184"}, {"Union Street_25534509" <->
   "South Silver Street_25534509",
  "25534509"}, {"Union Street_61147629" <-> "Crown Street_61147629",
  "61147629"}, {"Union Street_1511473322" <->
   "Bon-Accord Street_1511473322",
  "1511473322"}, {"Union Street_36719321" <->
   "Exchequer Row_36719321",
  "36719321"}, {"Union Street_36719323" <-> "Lodge Walk_36719323",
  "36719323"}, {"Union Street_17420453" <->
   "Marischal Street_17420453",
  "17420453"}, {"Union Street_17420452" <-> "Broad Street_17420452",
  "17420452"}, {"Union Street_17420453" <-> "King Street_17420453",
  "17420453"}, {"Union Street_17420453" <-> "Castlegate_17420453",
  "17420453"}, {"Union Street_288036759" <->
   "Back Wynd Stairs_288036759",
  "288036759"}, {"Union Street_17420438" <-> "Market Street_17420438",
   "17420438"}, {"Union Street_36684052" <-> "Back Wynd_36684052",
  "36684052"}, {"Union Street_36684011" <-> "Belmont Street_36684011",
   "36684011"}, {"Union Street_17420438" <->
   "St. Nicholas Street_17420438",
  "17420438"}, {"Union Street_36719566" <-> "Shiprow_36719566",
  "36719566"}, {"Union Street_25534506" <-> "Union Terrace_25534506",
  "25534506"}, {"Union Street_25534508" <-> "Diamond Street_25534508",
   "25534508"}, {"Union Street_25534506" <-> "Bridge Street_25534506",
   "25534506"}, {"Union Street_36719853" <->
   "St Catherine's Wynd_36719853",
  "36719853"}, {"Union Street_1081349358" <-> "Adelphi_1081349358",
  "1081349358"}}
So all we need to do to graph a street is
Graph[First /@ q]
That's not right. Its supposed to form a single line with other vertices branching off.
We need to connect the vertices which represent the path itself. Firstly
In[64]:=
pos = ToExpression /@ Lookup[nodeData, Last /@ q]
geoPos = getNodeGeoPosition /@ Last /@ q

Out[64]= {{57.1447, -2.10559}, {57.1443, -2.10677}, {57.1449, \
-2.10476}, {57.1451, -2.1042}, {57.1451, -2.10404}, {57.1443, \
-2.10674}, {57.1478, -2.09433}, {57.1479, -2.09379}, {57.1479, \
-2.0936}, {57.1476, -2.09502}, {57.1479, -2.0936}, {57.1479, \
-2.0936}, {57.1462, -2.10005}, {57.1469, -2.09746}, {57.1463, \
-2.09971}, {57.1461, -2.10059}, {57.1469, -2.09746}, {57.1475, \
-2.09521}, {57.1456, -2.10225}, {57.1453, -2.10314}, {57.1456, \
-2.10225}, {57.1474, -2.09563}, {57.1472, -2.09642}}

Out[65]= {GeoPosition[{57.1447, -2.10559}, "WGS84"],
 GeoPosition[{57.1443, -2.10677}, "WGS84"],
 GeoPosition[{57.1449, -2.10476}, "WGS84"],
 GeoPosition[{57.1451, -2.1042}, "WGS84"],
 GeoPosition[{57.1451, -2.10404}, "WGS84"],
 GeoPosition[{57.1443, -2.10674}, "WGS84"],
 GeoPosition[{57.1478, -2.09433}, "WGS84"],
 GeoPosition[{57.1479, -2.09379}, "WGS84"],
 GeoPosition[{57.1479, -2.0936}, "WGS84"],
 GeoPosition[{57.1476, -2.09502}, "WGS84"],
 GeoPosition[{57.1479, -2.0936}, "WGS84"],
 GeoPosition[{57.1479, -2.0936}, "WGS84"],
 GeoPosition[{57.1462, -2.10005}, "WGS84"],
 GeoPosition[{57.1469, -2.09746}, "WGS84"],
 GeoPosition[{57.1463, -2.09971}, "WGS84"],
 GeoPosition[{57.1461, -2.10059}, "WGS84"],
 GeoPosition[{57.1469, -2.09746}, "WGS84"],
 GeoPosition[{57.1475, -2.09521}, "WGS84"],
 GeoPosition[{57.1456, -2.10225}, "WGS84"],
 GeoPosition[{57.1453, -2.10314}, "WGS84"],
 GeoPosition[{57.1456, -2.10225}, "WGS84"],
 GeoPosition[{57.1474, -2.09563}, "WGS84"],
 GeoPosition[{57.1472, -2.09642}, "WGS84"]}
Check results
GeoGraphics[{
  Inset @@@ Transpose[{
     Range[Length[geoPos]],
     geoPos
     }]
  }]
They need to be in geographic order.
We obtain the end node of the path; it is assumed to be that which is furthest from the central location
In[66]:= first = MaximalBy[pos, EuclideanDistance[#, Mean[pos]] &][[1]]

Out[66]= {57.1443, -2.10677}
Using this result, we then find the node which is at the opposite end of the path in terms of its index in the list pos
In[96]:= {a, b} = {
  Flatten[Position[pos, first, 1, 1]][[1]],
  Flatten[
    Position[pos,
     Flatten[MaximalBy[pos, EuclideanDistance[#, first] &, UpTo[1]]],
     1, 1]][[1]]
  }

Out[96]= {2, 9}
Now we can sort the path nodes by using FindShortestTour
In[97]:= t = Last[FindShortestTour[geoPos, a, b]]

Out[97]= {2, 6, 1, 3, 4, 5, 20, 21, 19, 16, 13, 15, 17, 14, 23, 22, \
18, 10, 7, 8, 11, 12, 9}
And finally connect the internal nodes
interiorPath =
 EdgeList[PathGraph[
   DeleteDuplicates[(Delete[0] /@
       First /@
        q[[Flatten[Position[Last /@ q, #] & /@ (Last /@ q)[[t]]]]])[[
     1 ;; -1 ;; 2]]]]]

{"Union Street_42522651" <-> "Union Street_1511473322",
 "Union Street_1511473322" <-> "Union Street_25534510",
 "Union Street_25534510" <-> "Union Street_61151184",
 "Union Street_61151184" <-> "Union Street_25534509",
 "Union Street_25534509" <-> "Union Street_61147629",
 "Union Street_61147629" <-> "Union Street_25534508",
 "Union Street_25534508" <-> "Union Street_25534506",
 "Union Street_25534506" <-> "Union Street_36684011",
 "Union Street_36684011" <-> "Union Street_288036759",
 "Union Street_288036759" <-> "Union Street_36684052",
 "Union Street_36684052" <-> "Union Street_17420438",
 "Union Street_17420438" <-> "Union Street_1081349358",
 "Union Street_1081349358" <-> "Union Street_36719853",
 "Union Street_36719853" <-> "Union Street_36719566",
 "Union Street_36719566" <-> "Union Street_17420452",
 "Union Street_17420452" <-> "Union Street_36719321",
 "Union Street_36719321" <-> "Union Street_36719323",
 "Union Street_36719323" <-> "Union Street_17420453"}
We join the lists of internal and external connections
In[99]:= graphData = Join[
  interiorPath,
  First /@ q
  ]

Out[99]= {"Union Street_42522651" <-> "Union Street_1511473322",
 "Union Street_1511473322" <-> "Union Street_25534510",
 "Union Street_25534510" <-> "Union Street_61151184",
 "Union Street_61151184" <-> "Union Street_25534509",
 "Union Street_25534509" <-> "Union Street_61147629",
 "Union Street_61147629" <-> "Union Street_25534508",
 "Union Street_25534508" <-> "Union Street_25534506",
 "Union Street_25534506" <-> "Union Street_36684011",
 "Union Street_36684011" <-> "Union Street_288036759",
 "Union Street_288036759" <-> "Union Street_36684052",
 "Union Street_36684052" <-> "Union Street_17420438",
 "Union Street_17420438" <-> "Union Street_1081349358",
 "Union Street_1081349358" <-> "Union Street_36719853",
 "Union Street_36719853" <-> "Union Street_36719566",
 "Union Street_36719566" <-> "Union Street_17420452",
 "Union Street_17420452" <-> "Union Street_36719321",
 "Union Street_36719321" <-> "Union Street_36719323",
 "Union Street_36719323" <-> "Union Street_17420453",
 "Union Street_25534510" <-> "Huntly Street_25534510",
 "Union Street_42522651" <-> "Union Row_42522651",
 "Union Street_61151184" <-> "Dee Street_61151184",
 "Union Street_25534509" <-> "South Silver Street_25534509",
 "Union Street_61147629" <-> "Crown Street_61147629",
 "Union Street_1511473322" <-> "Bon-Accord Street_1511473322",
 "Union Street_36719321" <-> "Exchequer Row_36719321",
 "Union Street_36719323" <-> "Lodge Walk_36719323",
 "Union Street_17420453" <-> "Marischal Street_17420453",
 "Union Street_17420452" <-> "Broad Street_17420452",
 "Union Street_17420453" <-> "King Street_17420453",
 "Union Street_17420453" <-> "Castlegate_17420453",
 "Union Street_288036759" <-> "Back Wynd Stairs_288036759",
 "Union Street_17420438" <-> "Market Street_17420438",
 "Union Street_36684052" <-> "Back Wynd_36684052",
 "Union Street_36684011" <-> "Belmont Street_36684011",
 "Union Street_17420438" <-> "St. Nicholas Street_17420438",
 "Union Street_36719566" <-> "Shiprow_36719566",
 "Union Street_25534506" <-> "Union Terrace_25534506",
 "Union Street_25534508" <-> "Diamond Street_25534508",
 "Union Street_25534506" <-> "Bridge Street_25534506",
 "Union Street_36719853" <-> "St Catherine's Wynd_36719853",
 "Union Street_1081349358" <-> "Adelphi_1081349358"}
And obtain the desired result
Graph[graphData]
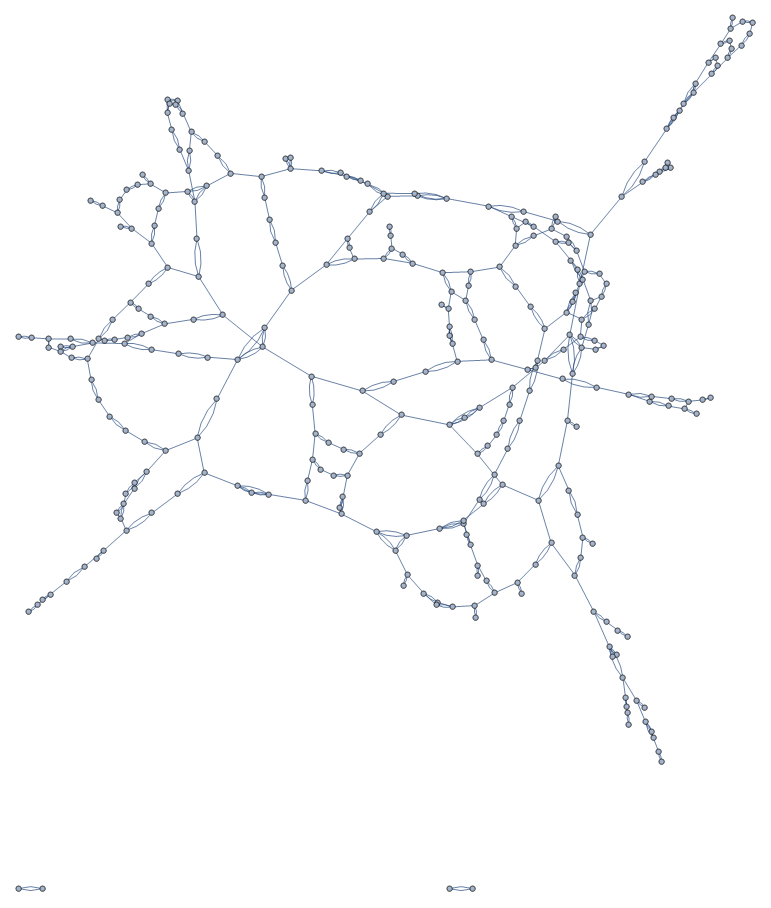
We're now ready to process the entire dataset
edgeLengths =
QuantityMagnitude /@ (UnitConvert[#, "SI"] & /@ (GeoDistance @@@
Partition[
GeoPosition[#,"WGS84"] & /@
ToExpression /@
Lookup[nodeData,
Last[StringSplit[#, "_"]] & /@
Delete[0] /@ EdgeList[Graph[Flatten[graphDataTotal]]]]
, 2]));
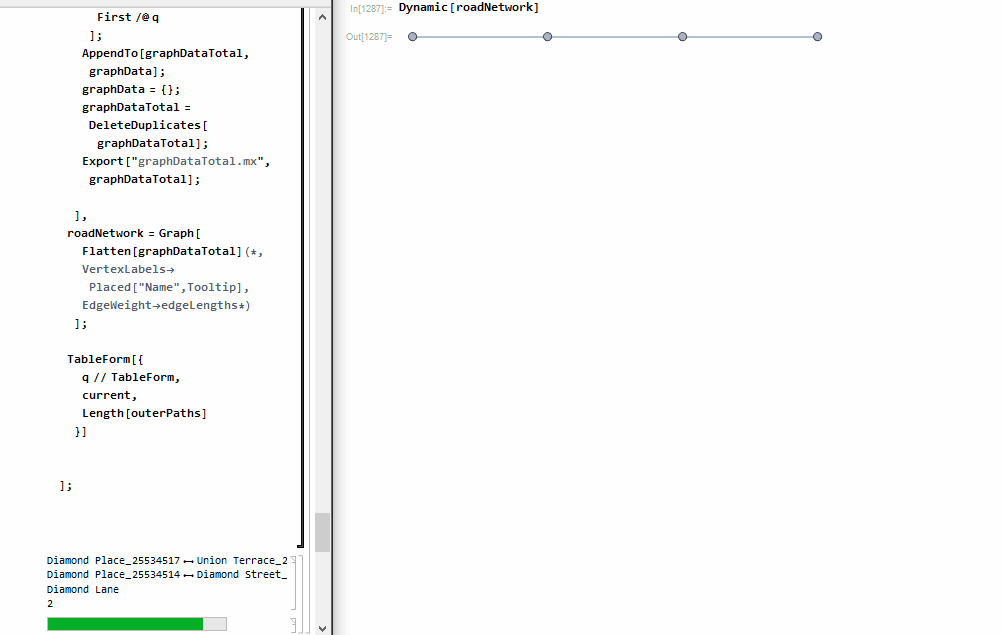
roadNetwork = Graph[
Flatten[graphDataTotal],
VertexLabels -> Placed["Name", Tooltip],
EdgeWeight -> edgeLengths
]
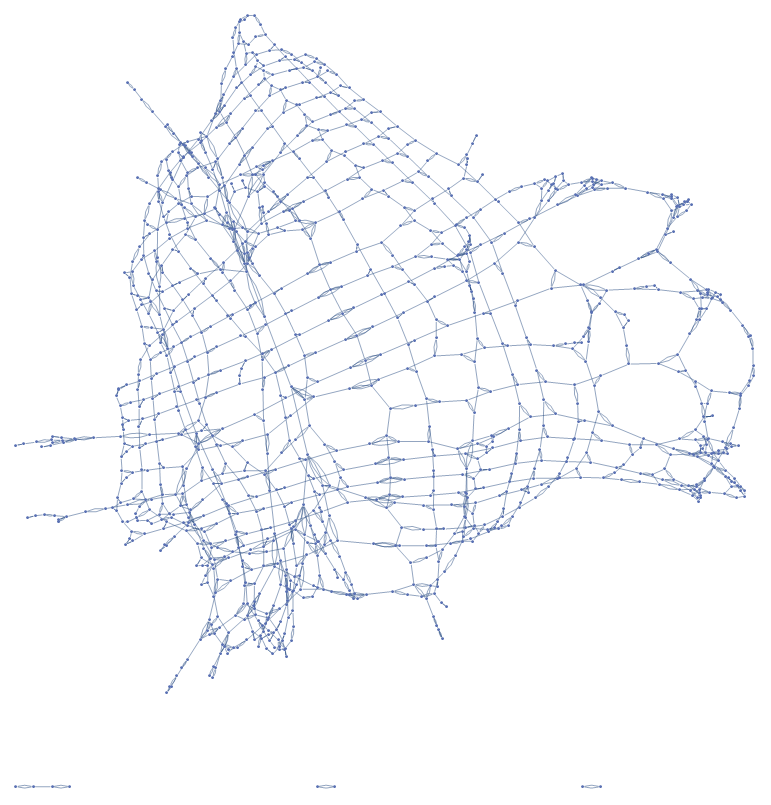
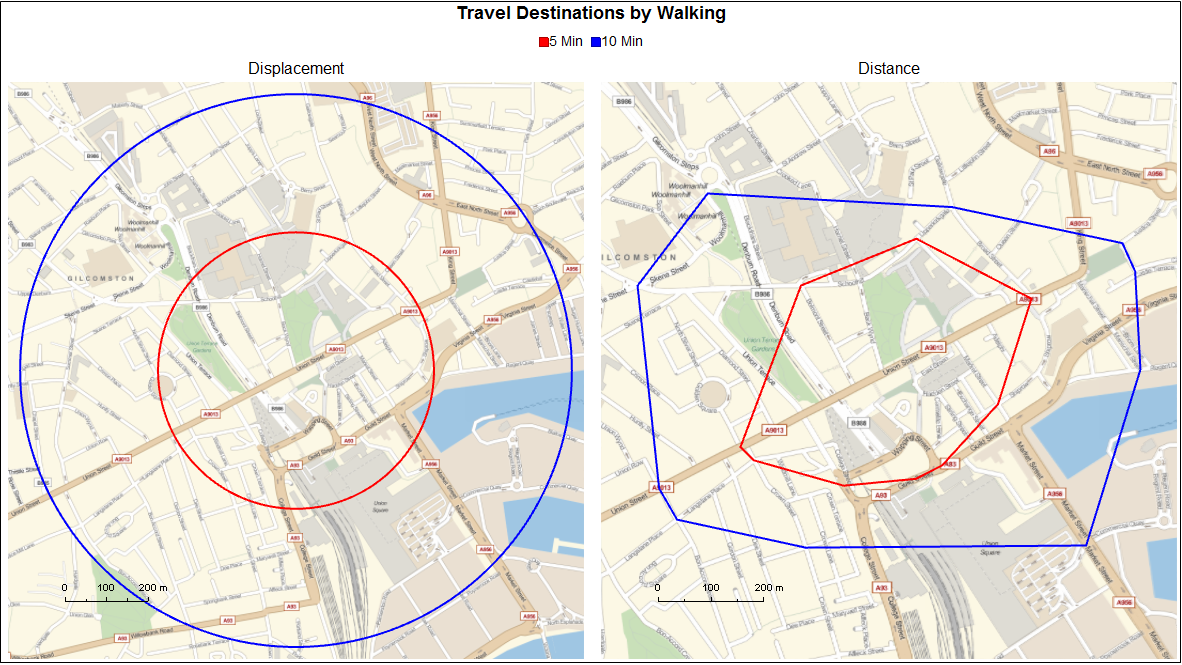
Aberdeen
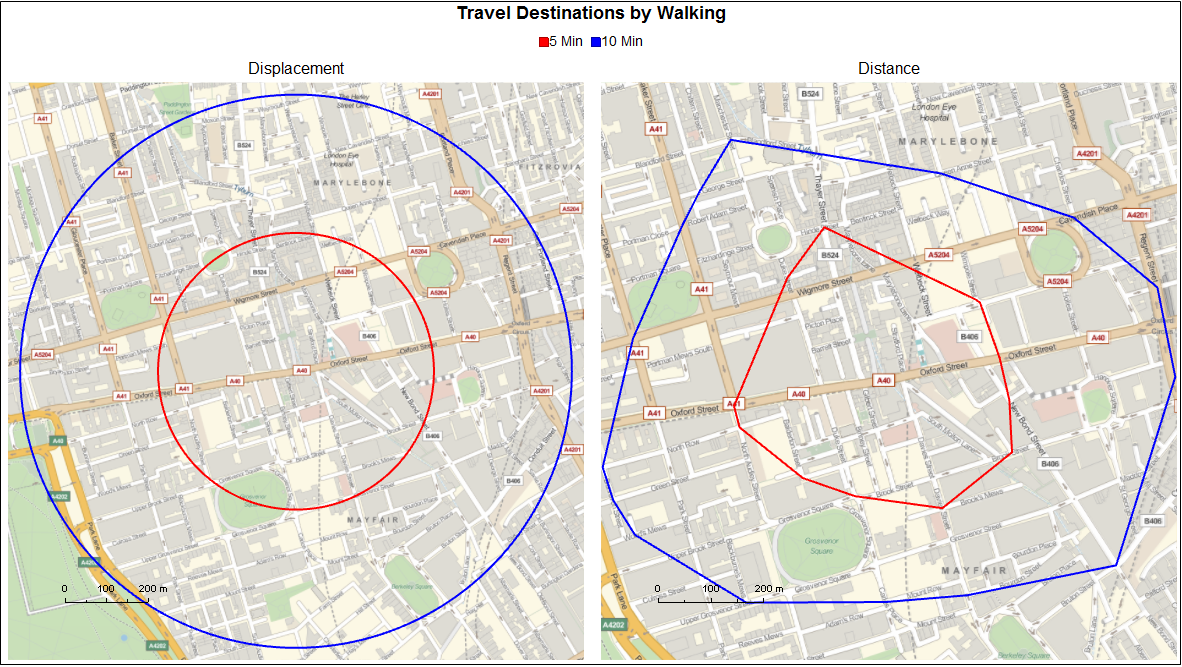
London
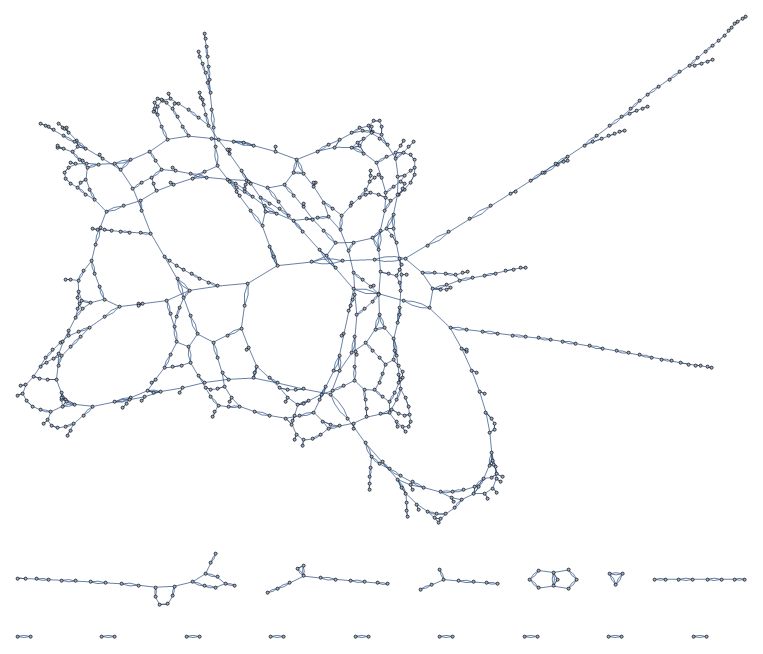
New York
How Far Can I Walk in 5 Minutes?
Its time to use the road network graph to answer the question which started this.
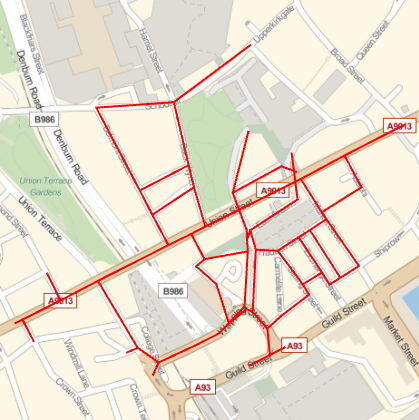
First, we need to define a starting location. For the Aberdeen graph, the start point is the same location as the map given in the photograph in the beginning of this post.
(* find/choose starting vertex *)
extractNodeString =
  Function[{edgePathList},
   Last /@ (StringSplit[#, ("_")] & /@ edgePathList)];

searchGraphVertex = Function[{
    searchName
    },

   With[{
     extract =
      Extract[VertexList[roadNetwork],
       Partition[
        First /@
         Position[StringCases[VertexList[roadNetwork], searchName],
          searchName], 1]]
     },
    TableForm[{
      {
       First /@
        Position[StringCases[VertexList[roadNetwork], searchName],
         searchName],
       extract,
       ToExpression /@
        Lookup[nodeData, Last /@ StringSplit[extract, "_"]]
       }
      }, TableHeadings -> {None, {"Position", "Name", "Location"}}]
    ]
   ];
geoPlotSearchGraphVertex = Function[{
    searchName
    },

   With[{
     extract =
      Extract[VertexList[roadNetwork],
       Partition[
        First /@
         Position[StringCases[VertexList[roadNetwork], searchName],
          searchName], 1]]
     },
    GeoGraphics[{
      GeoMarker[
       ToExpression /@
        Lookup[nodeData, Last /@ StringSplit[extract, "_"]]],
      Inset @@@ Transpose[{
         First /@
          Position[StringCases[VertexList[roadNetwork], searchName],
           searchName],
         GeoPosition /@
          ToExpression /@
           Lookup[nodeData,
            Last /@
             StringSplit[
              Extract[VertexList[roadNetwork],
               Partition[
                First /@
                 Position[
                  StringCases[VertexList[roadNetwork], searchName],
                  searchName], 1]], "_"]]
         }]
      },
     GeoRange -> Quantity[350, "m"],
     ImageSize -> Large
     ]
    ]
   ];
searchGraphByVertex =
  Function[{vertexName},
   Row[{searchGraphVertex[vertexName],
     geoPlotSearchGraphVertex[vertexName]}, Spacer[5]]];

searchGraphByVertex["Back Wynd"]
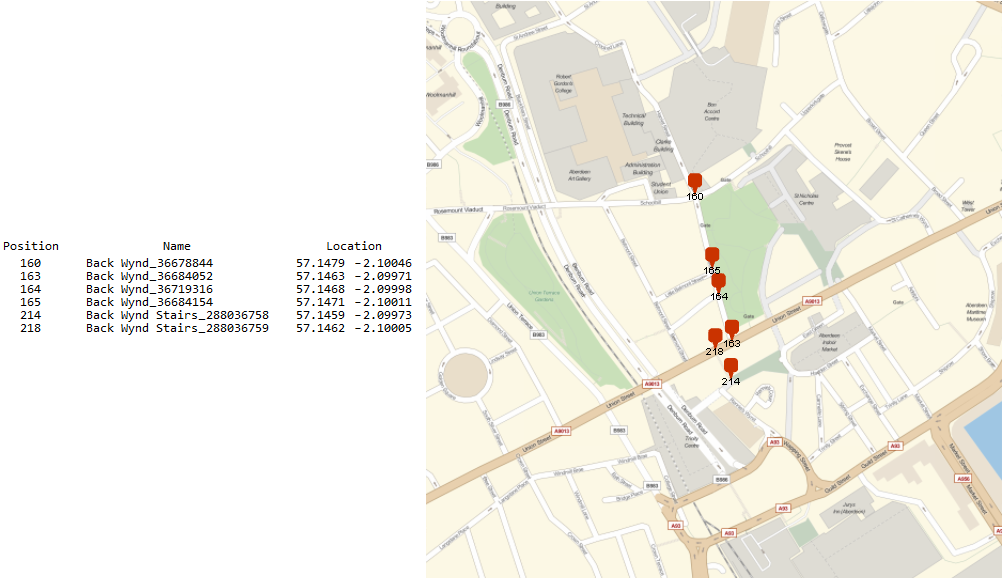
Graph vertex 163 is nearest.
Next we calculate the displacement from walking for 5 and 10 minutes
distance5Min =
 QuantityMagnitude[
  UnitConvert[
    WolframAlpha[
     "average walking speed", {{"Result", 1}, "ComputableData"}],
    "SI"]*Quantity[5, "minutes"]]

distance10Min =
 QuantityMagnitude[
  UnitConvert[
    WolframAlpha[
     "average walking speed", {{"Result", 1}, "ComputableData"}],
    "SI"]*Quantity[10, "minutes"]]

335.28

670.56
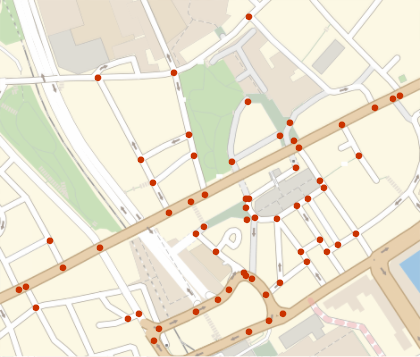
Find the destinations available within a 5 minute walk using GraphDistance
searchList = VertexList[roadNetwork];
startPoint = VertexList[roadNetwork][[163]];
sols = Extract[
   VertexList[roadNetwork],
   Position[(# <=
        distance5Min) & /@ (GraphDistance[roadNetwork,
         startPoint, #] & /@ searchList), True]
   ];

Row[{
  GeoGraphics[{
    GeoMarker[
     ToExpression /@
      Lookup[nodeData, Last /@ (StringSplit[#, "_"] & /@ sols)]
     ]

    },
   GeoRange -> Quantity[350, "m"],
   ImageSize -> Large
   ],
  Subgraph[roadNetwork, sols, ImageSize -> Large,
   VertexLabels -> Placed["Name", Tooltip]]
  }]
Optionally highlight the possible paths
l = Flatten[
FindPath[Subgraph[roadNetwork, sols],
startPoint, #, {0, distance5Min}, 2] & /@ sols, 1];
m = ToExpression /@ Lookup[nodeData, #] & /@ (extractNodeString /@ l);
GeoGraphics[{
{Red, Thick, JoinForm["Round"], GeoPath[m]}
},
GeoRange -> Quantity[300, "m"]
]
Back to destinations; we only need the outermost points.
destinationsByDistance = Function[{distance},
   DeleteDuplicates[
    ToExpression /@
     Lookup[nodeData, Last /@ (StringSplit[#, "_"] & /@ (
          Extract[
           VertexList[roadNetwork],

           Position[(# <=
                distance) & /@ (GraphDistance[roadNetwork,
                 startPoint, #] & /@ searchList), True]
           ]
          ))]]
   ];

GeoListPlot[GeoPosition /@ destinationsByDistance[distance5Min]]
From these points, we create a bounding mesh
Show[{
  ConvexHullMesh[destinationsByDistance[distance5Min]],
  Graphics[Point[destinationsByDistance[distance5Min]]]
  }]
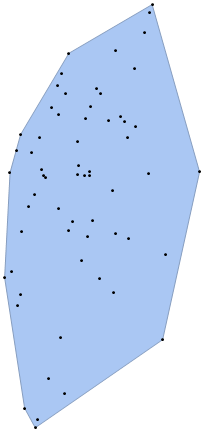
For the above mesh, what are the boundary locations?
GeoListPlot[
 GeoPosition /@
  MeshCoordinates[ConvexHullMesh[destinationsByDistance[distance5Min]]]
 ]
Now to present the results.
Once roadNetwork, nodeData and startPoint are defined, the following will create a plot of traversal space by foot for 5 and 10 minutes, by displacement and distance methods.
Framed[Column[{
   Style["Travel Destinations by Walking", "Subitem", Bold, 18],
   Row[{
     Row[{Red, Style["5 Min", "Subitem"]}],
     Row[{Blue, Style["10 Min", "Subitem"]}]
     }, Spacer[1]],
   Row[{
     Column[{
       Style["Displacement", "Subitem", 16],
       GeoGraphics[{
         {Red, Thick,
          GeoCircle[
           ToExpression /@
            nodeData[Last[StringSplit[startPoint, "_"]]],
           Quantity[distance5Min, "Meters"]
           ]
          },
         {Blue, Thick,
          GeoCircle[
           ToExpression /@
            nodeData[Last[StringSplit[startPoint, "_"]]],
           Quantity[distance10Min, "Meters"]
           ]
          }(*,
         Inset[Style["5 Min",Bold,14],GeoDestination[ToExpression/@
         nodeData[Last[StringSplit[startPoint,"_"]]],
         GeoDisplacement[{Quantity[distance5Min+10,"Meters"],\[Pi]/
         4}]]],
         Inset[Style["10 Min",Bold,14],GeoDestination[ToExpression/@
         nodeData[Last[StringSplit[startPoint,"_"]]],
         GeoDisplacement[{Quantity[distance10Min+10,"Meters"],\[Pi]/
         4}]]]*)
         }, GeoRange -> Quantity[700, "m"], GeoScaleBar -> "Meters",
        ImageSize -> Large]
       }, Alignment -> Center],

     Column[{
       Style["Distance", "Subitem", 16],
       With[{
         outerPoints5Min =
          MeshCoordinates[
           ConvexHullMesh[destinationsByDistance[distance5Min]]],
         outerPoints10Min =
          MeshCoordinates[
           ConvexHullMesh[destinationsByDistance[distance10Min]]]
         },
        GeoGraphics[{
          {
           Red, Thick,
           Line[GeoPosition /@
             outerPoints5Min[[
              Flatten[FindCurvePath[outerPoints5Min]]]]]
           },
          {
           Blue, Thick,
           Line[GeoPosition /@
             outerPoints10Min[[
              Flatten[FindCurvePath[outerPoints10Min]]]]]
           }
          }, GeoRange -> Quantity[550, "m"], GeoScaleBar -> "Meters",
         ImageSize -> Large]
        ]
       }, Alignment -> Center]
     }, Spacer[5]]
   }, Alignment -> Center, Spacings -> 1
  ]]
Aberdeen
London
New York
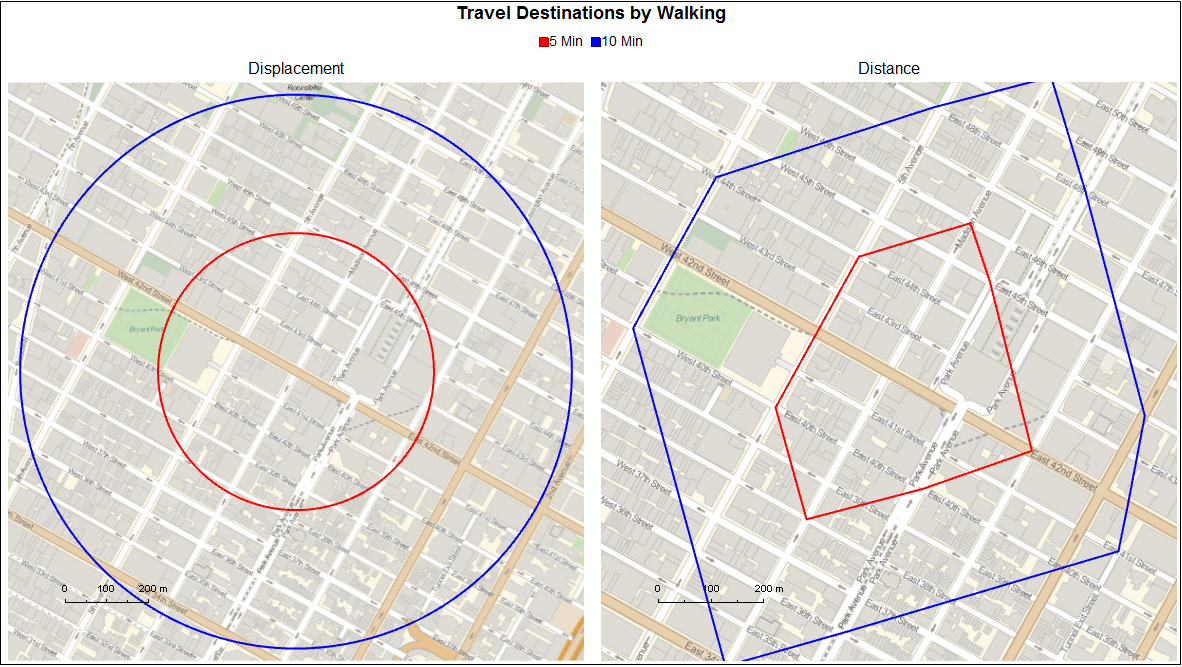
Conclusion
While the code to generate the graphs lacks much optimisation, the results are quite satisfying to see and maintain the same ethos of simplicity which the original displacement-based maps have. Since destination points are defined by the intersection between paths, the locations that one can walk to are rounded down to the nearest intersection. A more precises analysis could be obtained by interpolating additional geopositions along each edge of the graph. Furthermore, this method does not consider a paths behaviour (one way streets, pedestrianised zones ect). While not a necessity when considering a pedestrian in an urban environment, it would be if the graph were to be used to route paths for a vehicle.
The processed data for New York (graphDataTotal.mx, nodeData.mx) is provided (it required the longest time to compute) along with the raw OSM data for Aberdeen.
 Attachments:


