The simplest thing is to check related info in Wolfram|Alpha. For example album comparison:
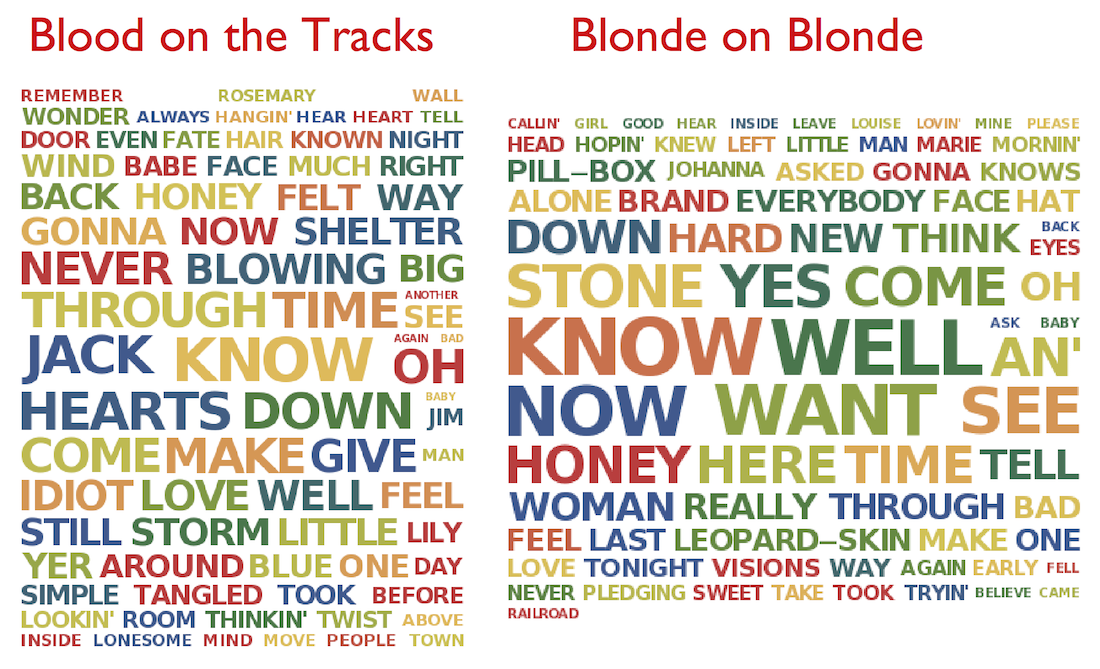
blonde on blonde vs blood on the tracks
will give, among other things, some beautiful album lyrics word clouds:

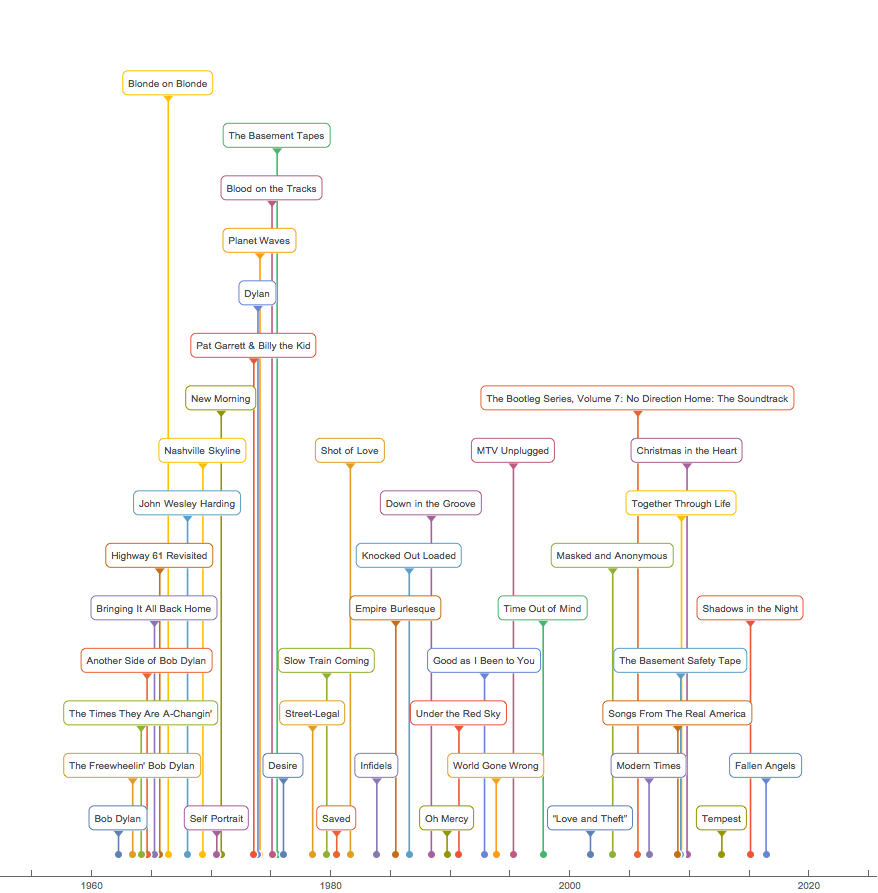
We can also get a timeline plot of albums:
Quiet@TimelinePlot[Rule @@@ DeleteCases[
    EntityValue[Entity["MusicAct", "BobDylan::p5236"]["Albums"],
        {"CanonicalReleaseDate", "Name"}], {_Missing, _}], PlotLayout -> "Packed"]

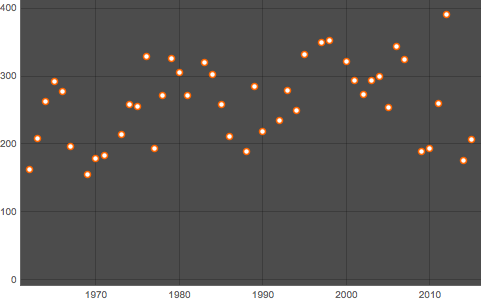
Median lengths of song recordings by year:
recordings = EntityClass["MusicWorkRecording",
    "RecordingMusicAct" -> Entity["MusicAct", "BobDylan::p5236"]][{"RecordingDate", "Length"}];

grouped = GroupBy[DeleteCases[
     recordings, {_, _Missing} | {_Missing, _}], #[[1]]["Year"] &][[All, All, 2]];

ListPlot[Median /@ grouped, PlotTheme -> "Marketing"]

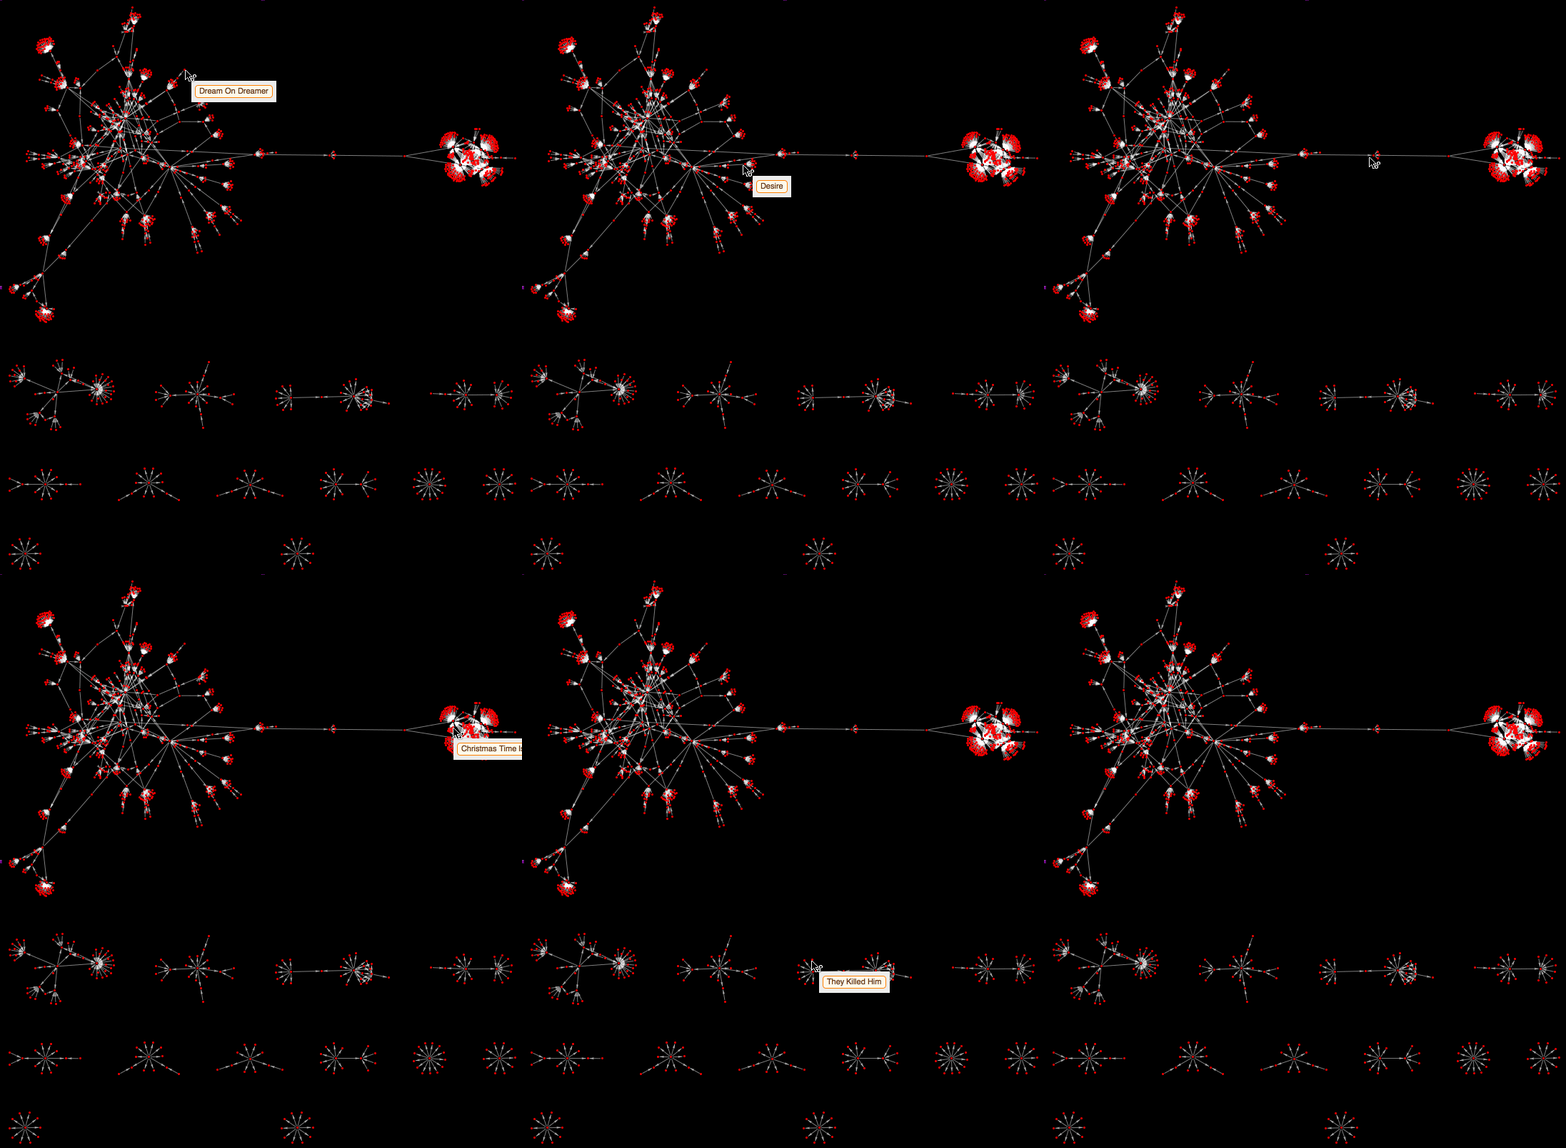
A graph this one tacks back up from specific music recordings (on specific album releases) to the more abstract songs
and then shows what other albums have featured some recording of those songs. So you get a view of other artists covering Dylan, what Dylan songs have showed up on the most compilation albums (that blob hanging off the right end of the topmost graph is a thicket of Christmas compilation albums)
WorksByAlbum=EntityClass["MusicWork","AssociatedMusicActs"->
    Entity["MusicAct","BobDylan::p5236"]][{"Entity","AssociatedMusicAlbums"}];

worksRules=Cases[WorksByAlbum,x_:>(#\[DirectedEdge]x[[1]]&/@x[[2]])];

Graph[Flatten[worksRules],VertexLabels->Placed["Name",Tooltip],VertexStyle->Red,EdgeStyle->White,Background->Black]
