Message Boards Message Boards

0
|
9346 Views
|
7 Replies
|
0 Total Likes
View groups...
Share
Share this post:

Change graphical icon when a variable take a specific value?

Posted 8 years ago

Hi,

As a dummy exemple, I created a new model, and its graphical icon is a green rectangle. I want it to become red when my Boolean variable is false. Is there any way to achieve such a thing? In the code hereunder I tried to add the condition

fillColor = if on then {0, 255, 0} else {255,0,0}

in the annotation, but this is not tolerated. I don't find any example in Modelica text books.

model myBlock
  Boolean on;
  annotation(Icon(coordinateSystem(extent = {{-100, -100}, {100, 100}}, preserveAspectRatio = true, initialScale = 0.1, grid = {10, 10}), graphics = {Rectangle(visible = true, fillColor = if on then {0, 255, 0} else {255,0,0}, fillPattern = FillPattern.Solid, extent = {{-100, -100}, {100, 100}})}), Diagram(coordinateSystem(extent = {{-148.5, -105}, {148.5, 105}}, preserveAspectRatio = true, initialScale = 0.1, grid = {5, 5})));
end myBlock;
POSTED BY: Romain Pinquié
7 Replies

This approach requires to duplicate the code, but I have no other alternative so far.

Thanks Neil!

POSTED BY: Romain Pinquié

For Johan or Wolfram people:

Is there documentation on the annotation syntax in SystemModeler?

Thanks

POSTED BY: Neil Singer

There is some documentation of annotations in the Modelica By Example book that is shipped with SystemModeler:

Other than that I think you have to resort to read the Modelica specification.

Otto

POSTED BY: Otto Tronarp

Johan is suggesting to use the visible attribute to do what you want. Here is a quick example.

model Model1
  parameter Boolean on = true;
  annotation(Diagram(coordinateSystem(extent = {{-148.5, -105}, {148.5, 105}}, preserveAspectRatio = true, initialScale = 0.1, grid = {5, 5}), graphics = {Ellipse(visible = not on, origin = {-27.5, 5}, fillColor = {0, 128, 0}, fillPattern = FillPattern.Solid, extent = {{-27.5, -40}, {27.5, 40}}), Rectangle(visible = on, origin = {-23.742, 5}, fillColor = {255, 0, 0}, fillPattern = FillPattern.Solid, extent = {{-51.258, -40}, {51.258, 40}}), Ellipse(visible = not on, origin = {32.5, 35.307}, fillColor = {0, 0, 255}, fillPattern = FillPattern.Solid, extent = {{-17.5, -17.255}, {17.5, 17.255}})}));
end Model1;

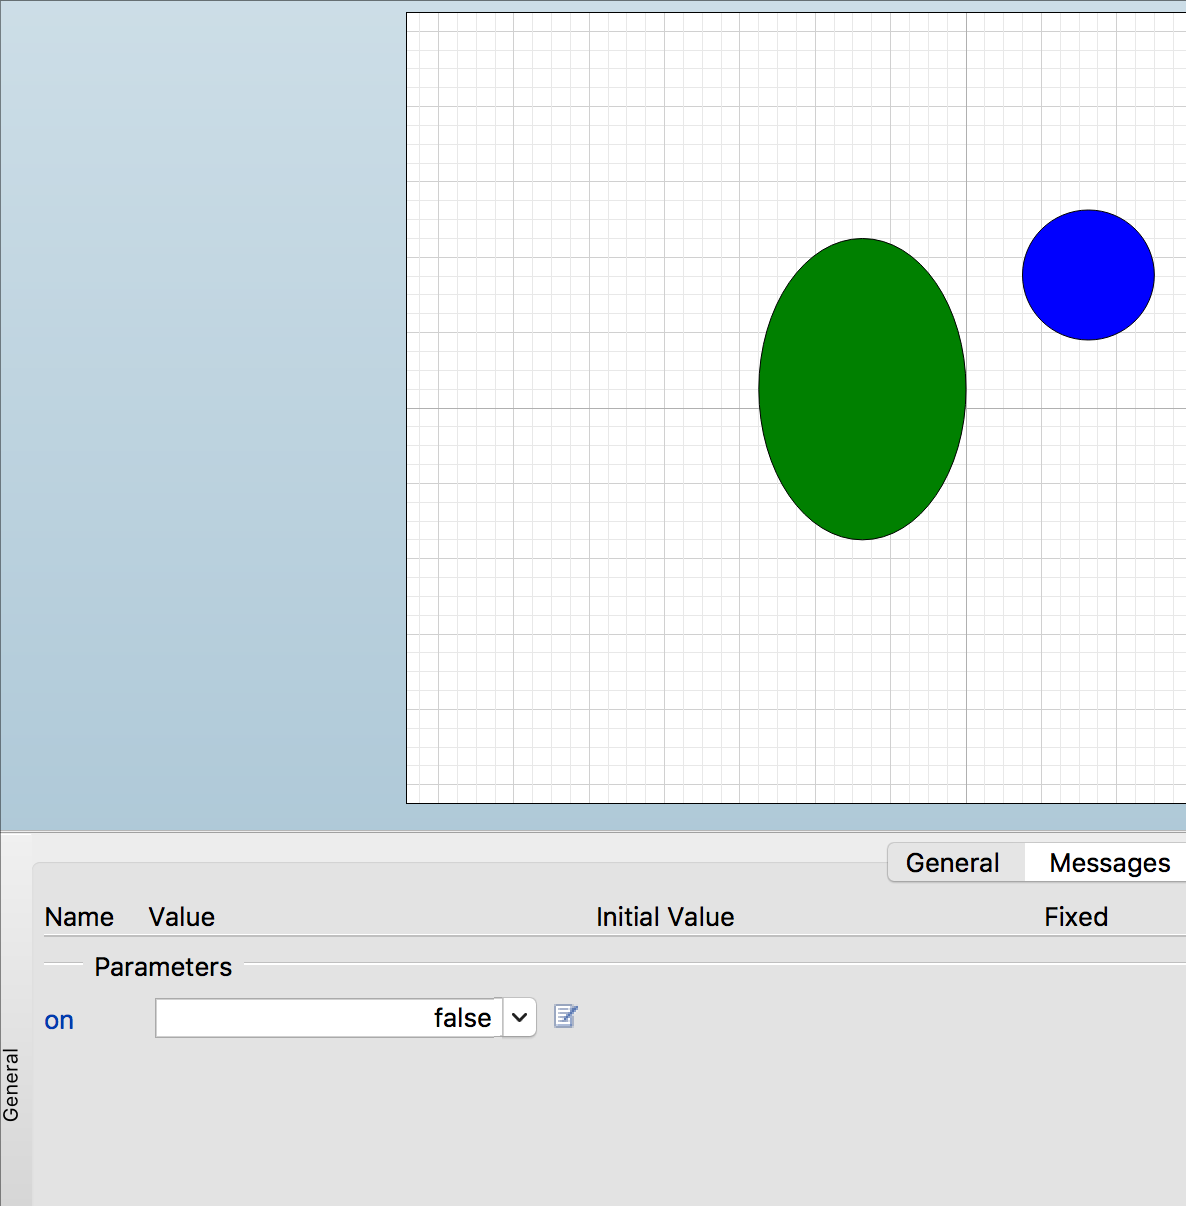
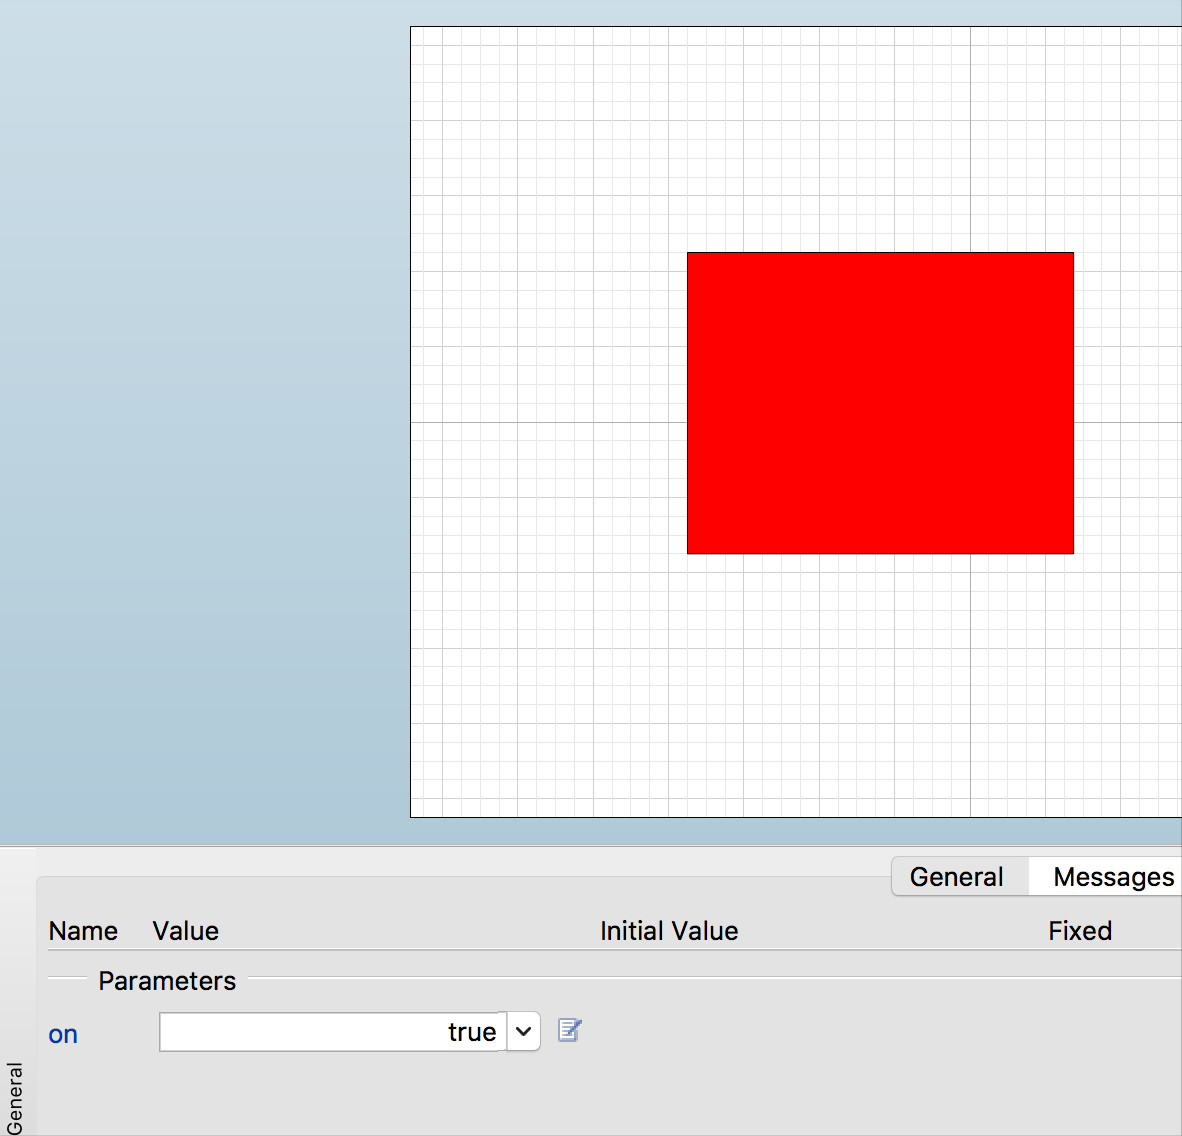
Note that I have a put a red square and a green and a blue circle on the diagram view. I then edited the annotation to make the "visible" attribute depend on the boolean variable (or you could use some test like x>3).

when true:

When True

When False

enter image description here

POSTED BY: Neil Singer

I've also tried the DynamicSelect() function as follows : fillColor = DynamicSelect({0, 255, 0}, if on then {0, 255, 0} else {255, 0, 0}). Although the Boolean variable is set to off, the colour of the block does not change from green to red after the simulation. I assume the DynamicSelect() function is not supported by SystemModeler...

Below is the dummy exemple:

model myBlock
  parameter Boolean on = false;
  annotation(Icon(coordinateSystem(extent = {{-100, -100}, {100, 100}}, preserveAspectRatio = true, initialScale = 0.1, grid = {10, 10}), graphics = {Rectangle(visible = true, fillColor = DynamicSelect({0, 255, 0}, if on then {0, 255, 0} else {255, 0, 0}), fillPattern = FillPattern.Solid, extent = {{-100, -100}, {100, 100}})}), Diagram(coordinateSystem(extent = {{-148.5, -105}, {148.5, 105}}, preserveAspectRatio = true, initialScale = 0.1, grid = {5, 5})));
end myBlock;
POSTED BY: Romain Pinquié

Joyan,

I can't get the solution. Can you let me know what's wrong in the exemple I provided in my first post?

Cheers,

Romain

POSTED BY: Romain Pinquié
Posted 8 years ago

Yes, you can use the same mechanism that is used for conditional components.

model testmodel
  parameter Boolean useHeatPort = true "=true, if HeatPort is enabled";
  Modelica.Thermal.HeatTransfer.Interfaces.HeatPort_a heatPort(T(start = T) = T_heatPort, Q_flow = -LossPower) if useHeatPort annotation(Placement(transformation(extent = {{-10, -110}, {10, -90}}), iconTransformation(extent = {{-10, -110}, {10, -90}})));
  annotation(Diagram(coordinateSystem(extent = {{-148.5, -105}, {148.5, 105}}, preserveAspectRatio = true, initialScale = 0.1, grid = {5, 5}), graphics = {Line(visible = if useHeatPort then true else false, origin = {0, -48.734}, points = {{0, -48.734}, {0, 48.734}})}));
end testmodel;
POSTED BY: Johan Rhodin
Reply to this discussion
Community posts can be styled and formatted using the Markdown syntax.
Reply Preview
Attachments
Remove
or Discard

Group Abstract Group Abstract