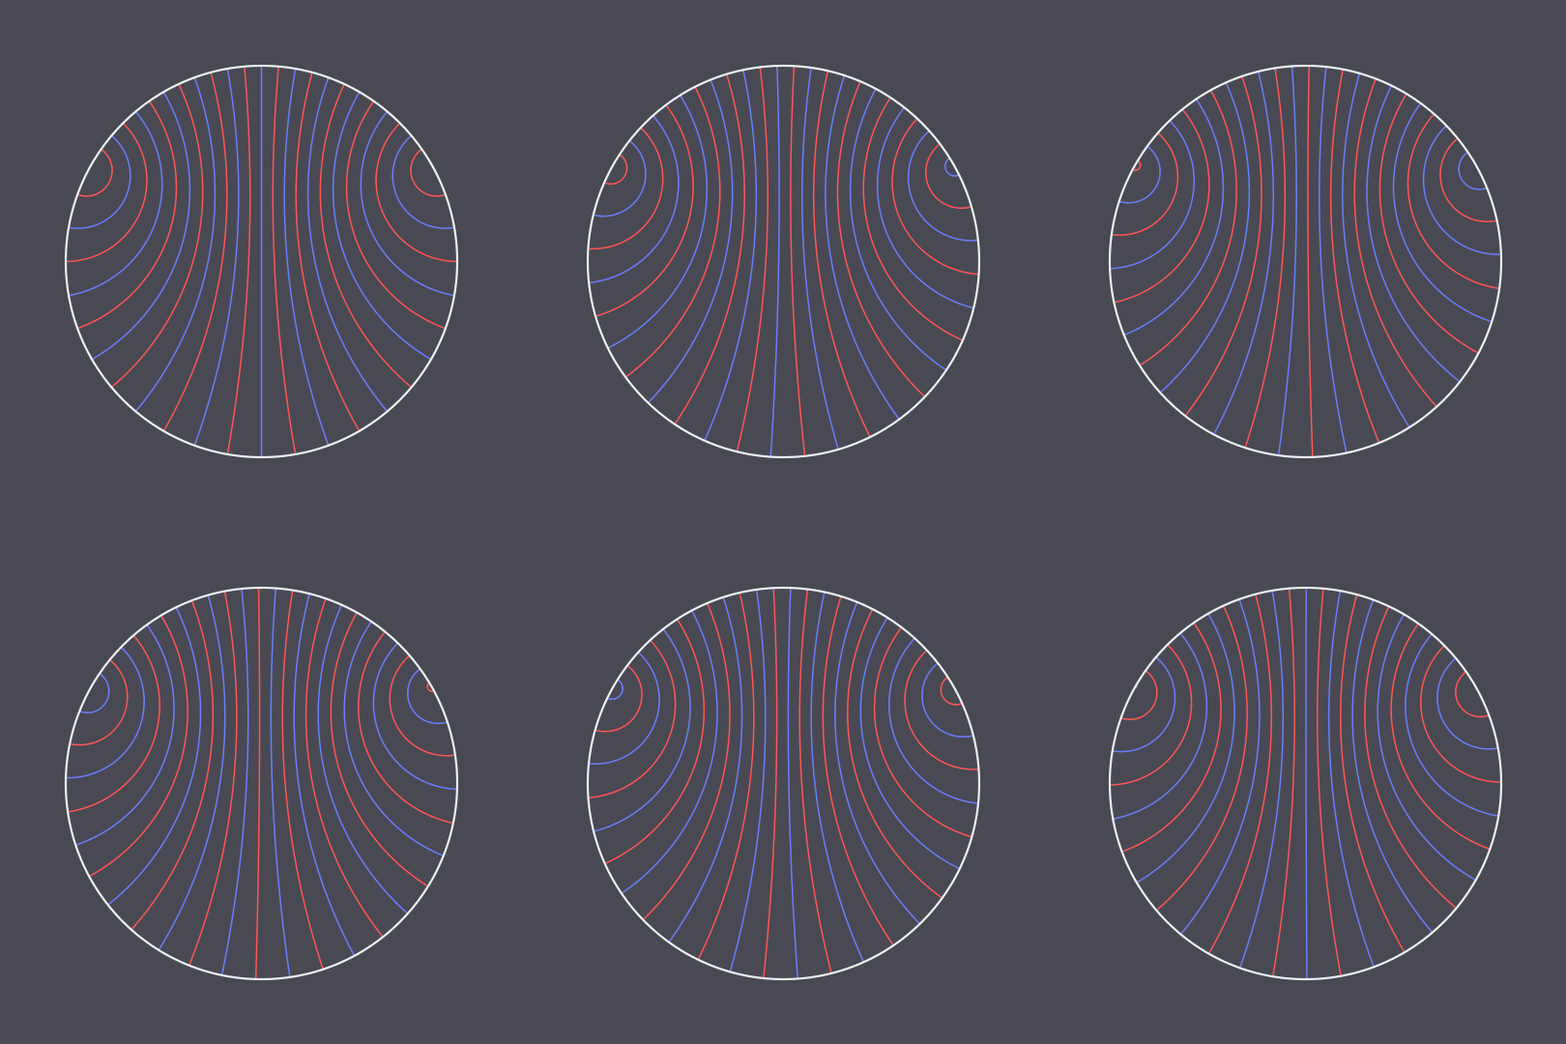
Stripes
Another animation using the hyperbolic geodesic code explained in more detail here, inspired by this GIF on Tumblr.
In this case, I have two non-antipodal points on the unit circle and pairs of points traveling the two (unequal) arcs between them in the same amount of time, connected by hyperbolic geodesics in the Poincaré disk model (which are just circle arcs perpendicular to the unit circle).
Here's the code:
Stereo[{x_, y_, z_}] := {x/(1 + z), y/(1 + z)};
InverseStereo[{x_, y_}] := 1/(1 + x^2 + y^2) {2 x, 2 y, 1 - x^2 - y^2};
hypgeo[p1_, p2_, t_] :=
  Stereo[Append[#,
      Sqrt[1 - Norm[#]^2]]] &[(1 - t) InverseStereo[p1][[;; 2]] +
    t InverseStereo[p2][[;; 2]]];

DynamicModule[{cols =
   RGBColor /@ {"#EDF2F6", "#FF5656", "#6A7EFC", "#494953"},
  n = 3,
  m = 72,
  pts,
  t
  },
 Manipulate[
    t = Mod[s, n/m];
    pts =
     Table[{{Cos[2 ?/n (t + a) + ?/6],
        Sin[2 ?/n (t + a) + ?/6]},
       {Cos[-2 (n - 1) ?/n (t + a) + ?/6],
        Sin[-2 (n - 1) ?/n (t + a) + ?/6]}},
      {a, 0, 1 - n/m, n/m}];
    Show[
     ParametricPlot[
      Evaluate[hypgeo[#[[1]], #[[2]], r] & /@ pts], {r, 0, 1},
      PlotStyle -> (If[EvenQ[Floor[s/(n/m)]], #,
           Reverse[#]] &[{Directive[cols[[3]], Thickness[.00275]],
          Directive[cols[[2]], Thickness[.00275]]}]), Axes -> False],
     Graphics[{Thickness[.004], cols[[1]], Circle[], cols[[2]]}],
     Background -> cols[[-1]], PlotRange -> 1.2, ImageSize -> 540
     ],
    {s, 0., 2 n/m - #, #}] &[n/(24 m)]
 ]