Message Boards Message Boards

[GiF] Visualizing the Bunimovich mitosis

Posted 7 years ago

enter image description here

Since a long time the eigenfunctions of the free-particle Hamiltonian for a stadium-shaped domain (Bunimovich stadium) with Dirichlet boundary conditions are used to study quantum chaos. A lot is known for a randomly selected higher eigenfunctions, e.g. its average nodal length or its similarity with a random analytic function.

But how much do the eigenfunctions change from psi[k] to psi[k+1]?

Here is a video showing the first 500 transitions: Bunimovich Stadium eigenfunction transitions

enter image description here

Construction:

Using a fine mesh, it is possible to interpolate directly between two eigenfunctions by plotting over the mesh vertices. This is faster than using plotting functions. We interpolate the eigenfunctions smoothly between u[k] to u[k+1]. The delta used for the above video was 0.0001.

? = 0.001;
dr = DiscretizeRegion[StadiumShape[], MaxCellMeasure -> ?]
{vals, funs} = 
  NDEigensystem[{-Laplacian[?[x, y], {x, y}], 
    DirichletCondition[?[x, y] == 0, True]}, ?[x, 
    y], {x, y} ? dr, 51, 
   Method -> {"Eigensystem" -> {"Arnoldi", "MaxIterations" -> 1000}}];

coords = MeshCoordinates[dr];
polys = Polygon[Developer`ToPackedArray[First /@ MeshCells[dr, 2]]];

frame[k?_] := 
 Module[{k, f1, f2, ?, vals, vals2},
  k = Floor[k?];
  f1 = funs[[k]][[0]]; f2 = funs[[k + 1]][[0]];
  ? = k? - k;
  vals = Cos[Pi/2 ?]^2 (f1 @@@ coords) + 
    Sin[Pi/2  ?]^2 (f2 @@@ coords);
      max = Max[Abs[vals]];
      vals2 = vals/max;
     Graphics[{EdgeForm[], Antialiasing -> True, 
    GraphicsComplex[coords, polys, 
     VertexColors -> (GrayLevel /@ (Abs[vals2]^0.5))], 
    Text[ If[Abs[k? - Round[k?]] <= 1/8, 
      Style[#, 18] &@ToString@Round[k?], ""], {0, -1.2}]},
                  PlotRange -> {{-2.1, 2.1}, {-1.3, 1.1}}]]

Here is the 50th eigenfunction:

frame[50] 

50th eigenfunction

For an efficient animation generation, we can further optimize and calculate (f1 @@@ coords) and (f2 @@@ coords) only once per eigenfunction pair.

POSTED BY: Michael Trott
4 Replies

Yes, the horizontal<-->vertical structures are to be expected. The stadium is convex and in a zeroth approximation just a rectangle.

A rectangle shows the same horizontal<-->vertical structures:

dr = DiscretizeRegion[Rectangle[{-3/2, -1}, {3/2, 1}], 
   MaxCellMeasure -> 0.0005];

{vals, funs} = NDEigensystem[{-Laplacian[\[Psi][x, y], {x, y}],
    DirichletCondition[\[Psi][x, y] == 0, True]}, \[Psi][x, 
    y], {x, y} \[Element] dr, 100,
   Method -> {"Eigensystem" -> {"Arnoldi", "MaxIterations" -> 1000}}];

coords = MeshCoordinates[dr];
polys = Polygon[Developer`ToPackedArray[First /@ MeshCells[dr, 2]]];

frame[k\[Alpha]_] := 
 Module[{ k = Floor[k\[Alpha]], f1, f2, \[Beta], max, vals2},
  f1 = funs[[k]][[0]]; f2 = funs[[k + 1]][[0]];
  \[Beta] = k\[Alpha] - k;
  vals = Cos[Pi/2 \[Beta]]^2 (f1 @@@ coords) + 
    Sin[Pi/2  \[Beta]]^2 (f2 @@@ coords);
      max = Max[Abs[vals]];
      vals2 = vals/max;
     Graphics[{EdgeForm[], Antialiasing -> True, 
    GraphicsComplex[coords, polys, 
     VertexColors -> (GrayLevel /@ (Abs[vals2]^0.5))],

    Text[ If[Abs[k\[Alpha] - Round[k\[Alpha]]] <= 1/8, 
      Style[#, 18] &@ToString@Round[k\[Alpha]], ""], {0, -1.2}]},
                  PlotRange -> {{-1.6, 1.6}, {-1.3, 1.1}}]]

Manipulate[frame[k\[Alpha]], {k\[Alpha], 1, Length[funs] - 1}]

If ones takes the exact solution

-Laplacian[#, {x, y}]/# &@(Sin[kx x/3 Pi] Sin[ky y Pi]) // Simplify

1/9 (kx^2 + 9 ky^2) \[Pi]^2

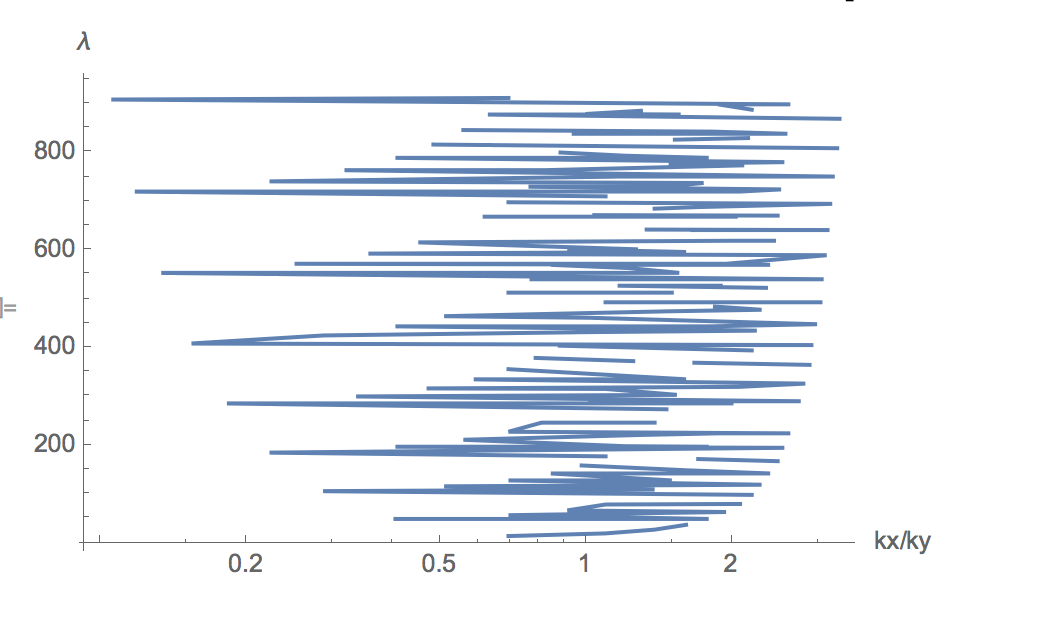
and plots the ratio of the number of oscillations horizontally and vertically as the ratio kx/ky, one sees that periodically one gets horizontal and vertical structures

ListLogLinearPlot[Take[#, 200] &@ SortBy[Flatten[Table[
     {Log[kx/ky], 1./9  (kx^2 + 9 ky^2) \[Pi]^2}, {kx, 100}, {ky, 
      100}], 1], Last[#] &], Joined -> True, 
 AxesLabel -> {"kx/ky", "\[Lambda]"}]

enter image description here

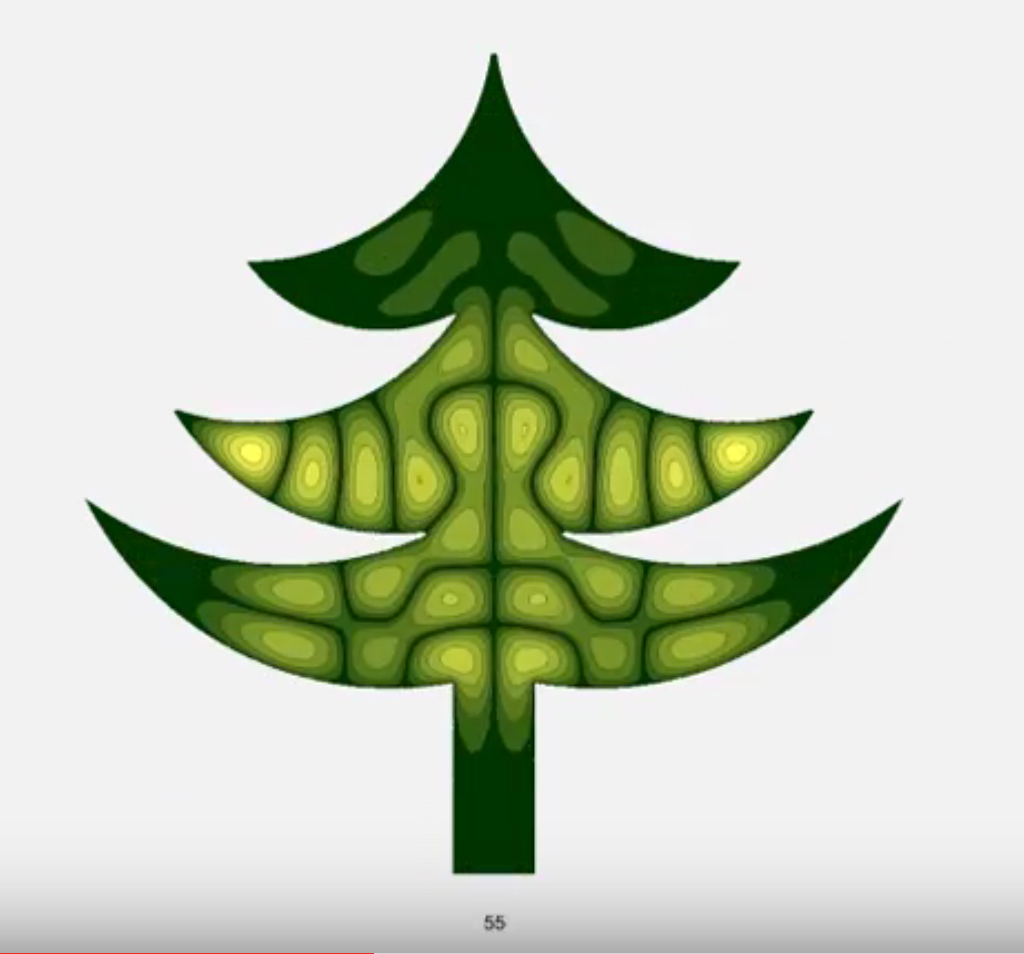
In a more complicated domains, e.g. a Christmas tree

https://www.youtube.com/watch?v=XL7xQMoouFE

the recurring structures can be of different types, e.g. certain subdomains of the region.

enter image description here

POSTED BY: Michael Trott

Very neat! Thanks for explaining Michael!

POSTED BY: Sander Huisman

Very cool Michael! Thanks for sharing! Is it 'logical' that the shapes go from 'horizontal' structures to 'vertical' structures all the time? Can it easily be explained? The only difference between the code and the video is the '51' (line 6) I presume?

POSTED BY: Sander Huisman

enter image description here - you have earned "Featured Contributor" badge, congratulations !

This is a great post and it has been selected for the curated Staff Picks group. Your profile is now distinguished by a "Featured Contributor" badge and displayed on the "Featured Contributor" board.

POSTED BY: Moderation Team
Reply to this discussion
Community posts can be styled and formatted using the Markdown syntax.
Reply Preview
Attachments
Remove
or Discard

Group Abstract Group Abstract