Message Boards Message Boards

Avoid strange behavior of ContourPlot in Mathematica?

Hi!

Let's define

f[x_, y_] = 1/(x^2 + y^2);

and draw two contours:

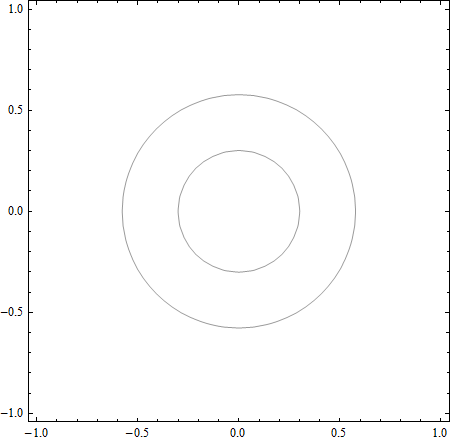
ContourPlot[{f[x, y] == 3, f[x, y] == 11}, {x, -1, 1}, {y, -1, 1}]

The result is OK:

fig1

But if we draw the same contours in another way:

ContourPlot[f[x, y], {x, -1, 1}, {y, -1, 1}, Contours -> {3, 11}, ColorFunction -> (White &)]

the result is

fig2

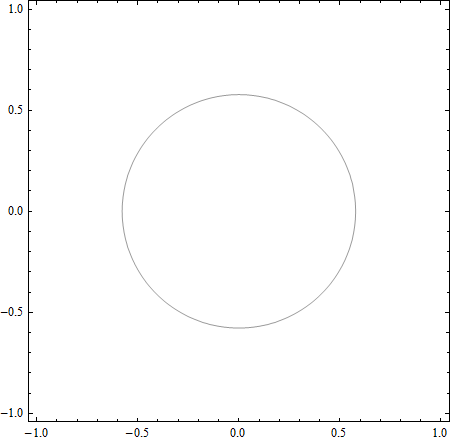
Where is the inner circle?

WBR, Vladimir,

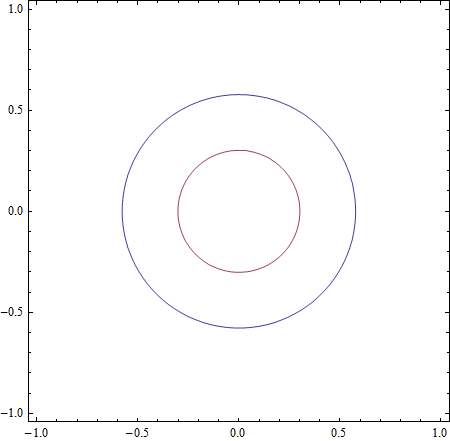
P. S. For the inverse function both contours are in their places:

ContourPlot[1/f[x, y], {x, -1, 1}, {y, -1, 1},  Contours -> {1/3, 1/11}, ColorFunction -> (White &)]

fig3

POSTED BY: Vladimir Ivanov
3 Replies

Gianluca Gorni, thank you, it works!

POSTED BY: Vladimir Ivanov

When you call ContourPlot with the Contours options, the algorithm may clip the range of the function, just as it happens with Plot3D or DensityPlot:

DensityPlot[1/(x^2 + y^2), {x, -2, 2}, {y, -2, 2}]

You can control the clipping with the option PlotRange. For example, with PlotRange->All you get both contours:

ContourPlot[1/(x^2 + y^2), {x, -2, 2}, {y, -2, 2}, PlotRange -> All, 
 Contours -> {3, 11}, ColorFunction -> (White &)]
POSTED BY: Gianluca Gorni

Can be reproduced in version 11 of Mathematica.

POSTED BY: Sander Huisman
Reply to this discussion
Community posts can be styled and formatted using the Markdown syntax.
Reply Preview
Attachments
Remove
or Discard

Group Abstract Group Abstract