I am trying to work with manipulate to show 3D plots, but for some reason the graphs are not what I expect them to be. I am using Mathematica 10.1. Using the code (from the "RegionFunction" help page)
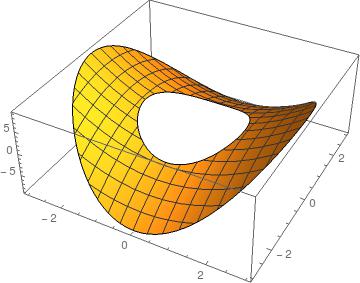
Plot3D[x^2 - y^2, {x, -3, 3}, {y, -3, 3}, RegionFunction -> Function[{x, y, z}, 2 < x^2 + y^2 < 9]]
I get the expected output:
However, when I insert the same code to manipulate,
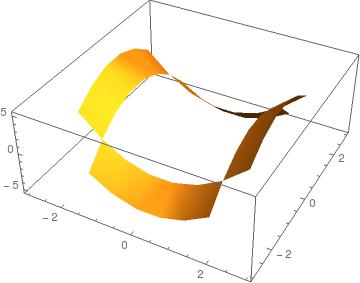
Manipulate[Plot3D[x^2 - y^2, {x, -3, 3}, {y, -3, 3}, RegionFunction -> Function[{x, y, z}, 2 < x^2 + y^2 < 9]], {t, 0, 1}]
I get a different graph:
Can someone please tell me what am I doing wrong? Thanks.


