Message Boards Message Boards

0
|
5041 Views
|
1 Reply
|
0 Total Likes
View groups...
Share
Share this post:

Plotting asymptotes as custom style

Posted 7 years ago

I use the plot command as follows

Plot[(x^3-9x)/(x^2-1),{x, -10,10}]

the function has two vertical Asymptote x=-1 and x=+1. Mathematica plots the function correctly . What I want to do is to plot the asymptotes as a dashed rather than a solid line. I appreciate any help. Can this be done interactively? If so, - how? I am using Mathematica 10.

Thanks, JME

POSTED BY: Javad Emami

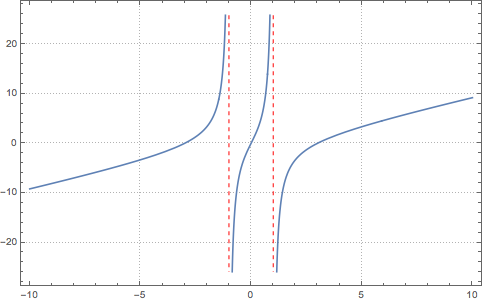
Reading documentation really helps (search for asymptotes). Also searching internet does. Little effort would lead to something like this:

Plot[(x^3 - 9 x)/(x^2 - 1), {x, -10, 10},
 Exclusions -> {-1, 1},
 ExclusionsStyle -> Dashed,
 PlotTheme -> "Detailed"]

enter image description here

POSTED BY: Sam Carrettie
Reply to this discussion
Community posts can be styled and formatted using the Markdown syntax.
Reply Preview
Attachments
Remove
or Discard

Group Abstract Group Abstract