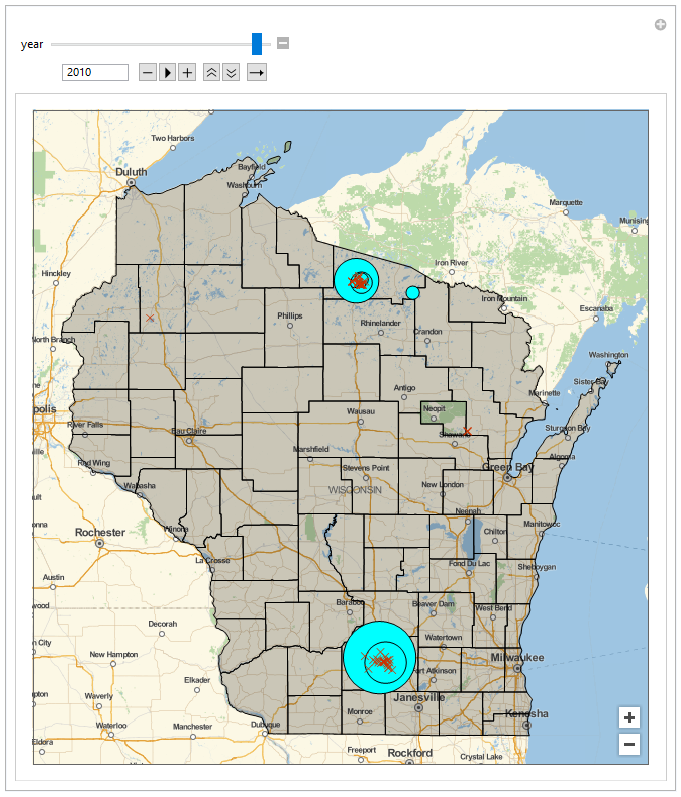
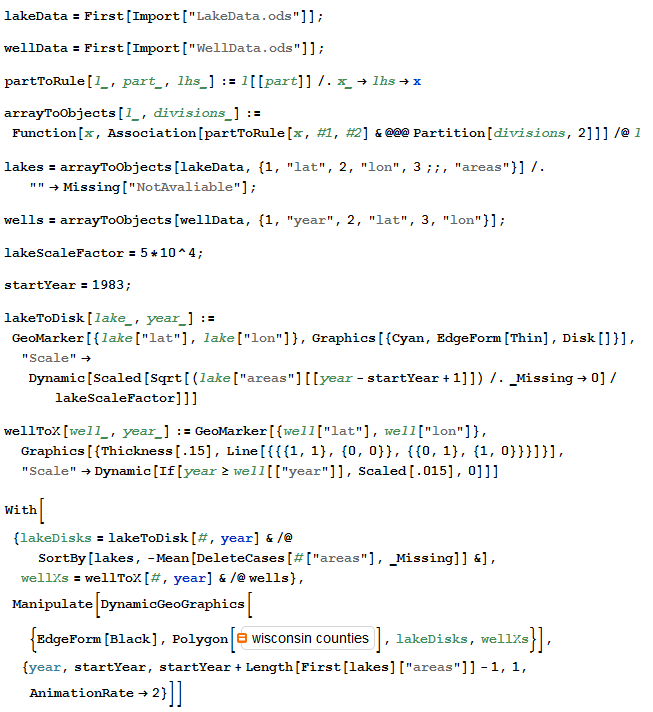
My wife was working on her PHD in geoscience at UW Madison, and her research was on how wells affect lake levels in Wisconsin. She wanted to be able to visualize this, and we decided the Wolfram Language would be useful for what she was trying to do. Here's some code we worked on together which displays a dynamic map of Wisconsin which one can zoom in and out on, and that has a slider which allows you to change the date. As one changes the date, the areas change, and also little red x's appear which represent wells being added to the landscape over the years. The size of the disks representing lakes are independent of zoom level so that one can better visualize all the lakes while at different zoom levels.
She's not working on her PHD anymore, and the data that we used is incomplete. For a number of the years in the simulation the lakes just disappear because we don't have the data on the lake areas for those years, but we just thought we'd share what we have now anyway.
I have attached the Wolfram Language notebook and the two spreadsheet files needed to run the code.
 Attachments:


