Message Boards Message Boards

0
|
7378 Views
|
4 Replies
|
3 Total Likes
View groups...
Share
Share this post:

[?] Give a different color to each point in a plot of points?

Posted 7 years ago

Hello everyone, I'm new in mathematica so I have had some problems with it :/ . I have to make a plot from a science data in a 3D plot using points, and I have to give to each point a different color... and that's where is my issue. I've been trying with this

colorfunc = ColorData["Rainbow"];
norm = (vels - Min[vels])*1000;   (*Some of the velocities are <0 so I plus them a value to avoid this.*)
cs = Normalize[norm];  
Graphics3D[{PointSize[0.005], colorfunc@#[[1]], Point[#[[2]]]} & /@ Transpose[{cs, coord}], Axes -> True]

where coord is a 3D list of points (x,y and z cords),vels is a list with velocities, cs is the list containing the data for the colors. My problem is that when I execute the code the graph that I get has all the points with pretty similar colors, and I already know that I should see a difference between them, so I'm asking you for help with this. How should I give a different color to each point in such a way that I can see the difference between each point? Thank you.

POSTED BY: Brayan Del Valle
4 Replies

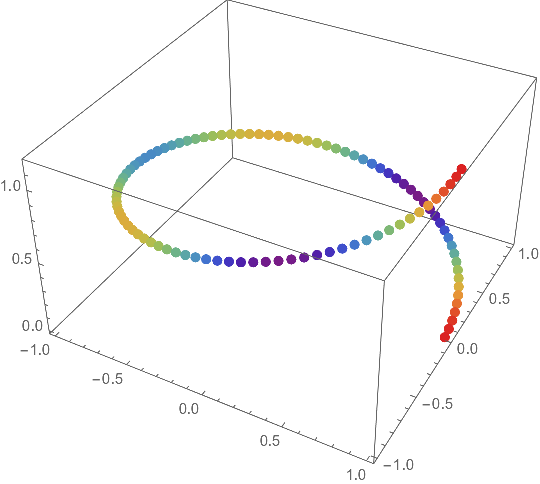
There is a built-in function for doing what you want, Rescale:

colorfunc = ColorData["Rainbow"];
Graphics3D[{PointSize[0.02], 
  Point[coord, VertexColors -> colorfunc /@ Rescale[vels]]},
 Axes -> True]

enter image description here

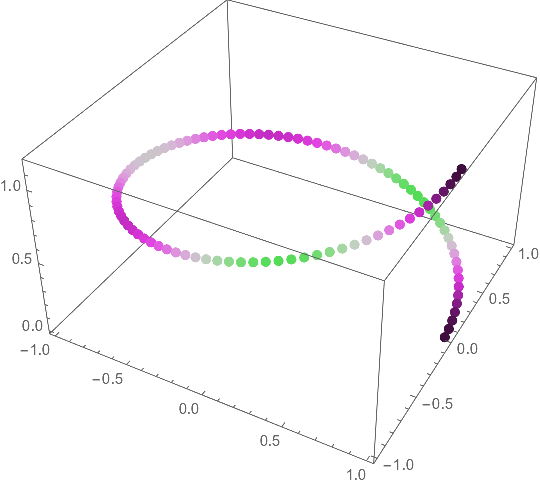
Since you mention the zero velocity, you might want to control what color represents zero. The Interpolation below runs uniformly between ± the maximum speed, so that the zero velocity coincides with the color at 0.5. It can be used to rescale the velocity.

resc = Interpolation[{{-Max@Abs[vels], 0.}, {Max@Abs[vels], 1.}}, InterpolationOrder -> 1]; (* assume velocities of different signs *)
colorfunc = Blend[{ColorData["TemperatureMap"][#], Black}, (1.2 # (1 - #))^2] &;
Graphics3D[
 {PointSize[0.02], Point[coord, VertexColors -> colorfunc /@ resc[vels]]},
 Axes -> True]

enter image description here

One can give more waypoints to the interpolation so that the zero velocity is assigned specifically to a value. The scaling above and below zero can vary. For example,

resc2 = Interpolation[{{Min[vels], 0.}, {0., 0.5}, {Max[vels], 1.}}, InterpolationOrder -> 1];

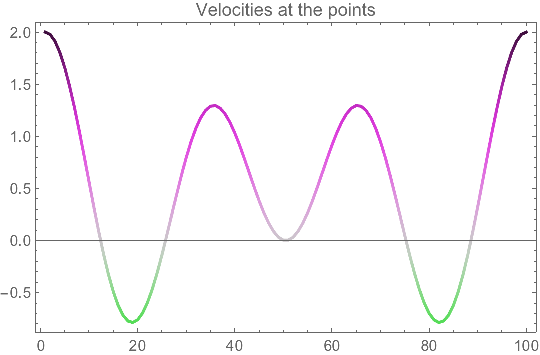
One can plot the velocities, too:

Graphics[{
  Thick,
  Line[MapIndexed[Flatten@{#2, #1} &, vels], 
   VertexColors -> colorfunc /@ resc[vels]]
  }, AspectRatio -> 0.618, Axes -> True, Frame -> True, 
 PlotLabel -> "Velocities at the points"]

enter image description here

POSTED BY: Michael Rogers

If you index your points by i you could use ColorData[97][I] for your colorfunc. This gives a distinctly different color for adjacent points on the list but the colors are pretty much random. Look at the Color Schemes palette, 97 under Indexed. This is, by the way, what Mathematica uses for coloring successive curves when plotted in a single Plot statement.

It works, I thank you very much :).

POSTED BY: Brayan Del Valle

Hi,

try

cs = (norm/Max[norm]);

Cheers,

Marco

POSTED BY: Marco Thiel
Reply to this discussion
Community posts can be styled and formatted using the Markdown syntax.
Reply Preview
Attachments
Remove
or Discard

Group Abstract Group Abstract