Hi everyone,
I just noted that the icons for some components I have created are not properly visualized when having them displayed in Mathematica using SytemModel["model"]["Diagram"]. Here is a very short minimal example for the behavior:
model DemoIconDisplay
  partial model UnidirectionalFlow "Icon for unidirectional flow classes"
    annotation(Icon(coordinateSystem(extent = {{-100, -100}, {100, 100}}, preserveAspectRatio = true, initialScale = 0.1, grid = {10, 10}), graphics = {Rectangle(visible = true, lineColor = {0, 128, 0}, fillColor = {255, 255, 255}, fillPattern = FillPattern.Solid, lineThickness = 5, extent = {{-100, -100}, {100, 100}}), Rectangle(visible = true, lineColor = {0, 128, 0}, fillColor = {255, 255, 255}, fillPattern = FillPattern.Solid, lineThickness = 5, extent = {{-100, -100}, {100, 100}}), Line(visible = true, origin = {-2.596, -11.973}, points = {{-72.3, 0}, {72.3, 0}}, color = {0, 128, 0}, thickness = 5), Line(visible = true, origin = {-1.216, 11.777}, points = {{-73.637, 0}, {73.637, 0}}, color = {0, 128, 0}, thickness = 5), Polygon(visible = true, origin = {72.114, -0.25}, rotation = -450, lineColor = {0, 128, 0}, fillColor = {0, 128, 0}, fillPattern = FillPattern.Solid, points = {{-22.295, -7.943}, {22.191, -7.943}, {0.104, 15.886}}), Text(visible = true, origin = {-73.452, 37.479}, textColor = {0, 128, 0}, extent = {{-13.452, -20}, {13.452, 20}}, textString = "A"), Text(visible = true, origin = {73.452, -43.134}, textColor = {0, 128, 0}, extent = {{-13.452, -20}, {13.452, 20}}, textString = "B"), Ellipse(visible = true, origin = {1.899, 0}, lineColor = {0, 128, 0}, fillColor = {0, 128, 0}, fillPattern = FillPattern.Solid, lineThickness = 5, extent = {{-15.107, -15.107}, {15.107, 15.107}}), Text(visible = true, origin = {2.487, 1}, textColor = {255, 255, 255}, extent = {{-16.513, -12.307}, {16.513, 12.307}}, textString = "X", textStyle = {TextStyle.Bold})}), Diagram(coordinateSystem(extent = {{-148.5, -105}, {148.5, 105}}, preserveAspectRatio = true, initialScale = 0.1, grid = {5, 5})));
  end UnidirectionalFlow;

  partial model Interaction "Icon for interactional flow classes"
    annotation(Icon(coordinateSystem(extent = {{-100, -100}, {100, 100}}, preserveAspectRatio = true, initialScale = 0.1, grid = {10, 10}), graphics = {Rectangle(visible = true, lineColor = {0, 128, 0}, fillColor = {255, 255, 255}, fillPattern = FillPattern.Solid, lineThickness = 5, extent = {{-100, -100}, {100, 100}}), Line(visible = true, origin = {-1.596, -11.973}, points = {{-71, 0}, {71, 0}}, color = {0, 128, 0}, thickness = 5), Line(visible = true, origin = {-0.216, 11.777}, points = {{-73, 0}, {73, 0}}, color = {0, 128, 0}, thickness = 5), Polygon(visible = true, origin = {72.114, -0.25}, rotation = -450, lineColor = {0, 128, 0}, fillColor = {0, 128, 0}, fillPattern = FillPattern.Solid, points = {{-22.295, -7.943}, {22.191, -7.943}, {0.104, 15.886}}), Text(visible = true, origin = {-73.452, 37.479}, textColor = {0, 128, 0}, extent = {{-13.452, -20}, {13.452, 20}}, textString = "A"), Text(visible = true, origin = {73.452, -43.134}, textColor = {0, 128, 0}, extent = {{-13.452, -20}, {13.452, 20}}, textString = "B"), Polygon(visible = true, origin = {-72.424, 0}, rotation = 450, lineColor = {0, 128, 0}, fillColor = {0, 128, 0}, fillPattern = FillPattern.Solid, points = {{22.295, -7.943}, {-22.191, -7.943}, {-0.104, 15.886}}), Rectangle(visible = true, origin = {40.723, 0.173}, lineColor = {0, 128, 0}, fillColor = {0, 128, 0}, fillPattern = FillPattern.Solid, extent = {{-26.573, -12.251}, {26.573, 12.251}}), Ellipse(visible = true, origin = {1.899, 0}, lineColor = {255, 255, 255}, fillColor = {0, 128, 0}, fillPattern = FillPattern.Solid, lineThickness = 5, extent = {{-15.107, -15.107}, {15.107, 15.107}}), Text(visible = true, origin = {2.487, 0}, textColor = {255, 255, 255}, extent = {{-16.513, -12.307}, {16.513, 12.307}}, textString = "X", textStyle = {TextStyle.Bold}), Text(visible = true, origin = {74.452, -0.51}, textColor = {255, 255, 255}, extent = {{-13.452, -20}, {13.452, 20}}, textString = "+", fontSize = 72), Text(visible = true, origin = {-74.548, -0.51}, textColor = {255, 255, 255}, extent = {{-13.452, -20}, {13.452, 20}}, textString = "+", fontSize = 72)}), Diagram(coordinateSystem(extent = {{-148.5, -105}, {148.5, 105}}, preserveAspectRatio = true, initialScale = 0.1, grid = {5, 5})));
  end Interaction;

  replaceable Interaction interaction1 annotation(Placement(visible = true, transformation(origin = {-30, 10}, extent = {{-10, -10}, {10, 10}}, rotation = 0)));
  replaceable UnidirectionalFlow unidirectionalFlow1 annotation(Placement(visible = true, transformation(origin = {10, 10}, extent = {{-10, -10}, {10, 10}}, rotation = 0)));
  annotation(Diagram(coordinateSystem(extent = {{-150, -90}, {150, 90}}, preserveAspectRatio = true, initialScale = 0.1, grid = {5, 5})), Icon(coordinateSystem(extent = {{-100, -100}, {100, 100}}, preserveAspectRatio = true, initialScale = 0.1, grid = {10, 10}), graphics = {Rectangle(visible = true, lineColor = {0, 114, 195}, fillColor = {255, 255, 255}, extent = {{-100, -100}, {100, 100}}, radius = 25), Text(visible = true, textColor = {64, 64, 64}, extent = {{-150, 110}, {150, 150}}, textString = "%name")}));
end DemoIconDisplay;
Now in a Mathematica notebook I can read in the model or enter it as a string (escaping the quotes and backlashes to appear verbatim) model = ImportString[ " <paste code here> ", "mo" ].
model = SystemModel["DemoIconDisplay"] (* or model = ImportString[ " <paste code here> ", "mo" ] *)
The model representation already does not look too good being very coarsely rendered. Let's look at the individual components' icons:
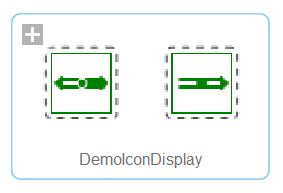
Through[ model["Children"]["ModelicaIcon"] ]
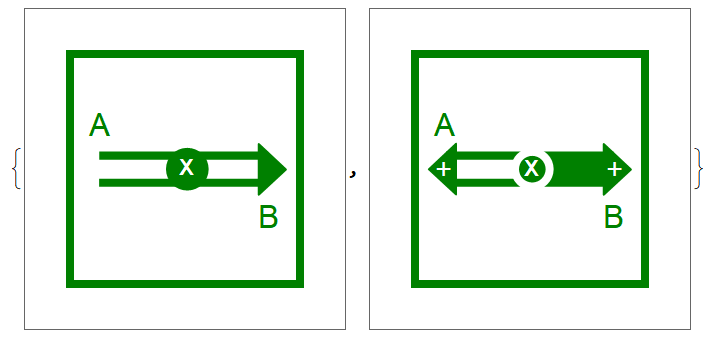
That is exactly how the components' icons look in System Model and in System Modeler Diagrams (using Version 12.0). All is nice and crisp.
But now, let's have a look at a model diagram, where the partial models have been instantiated. Again, in Mathematica, we do:
model["Diagram"]
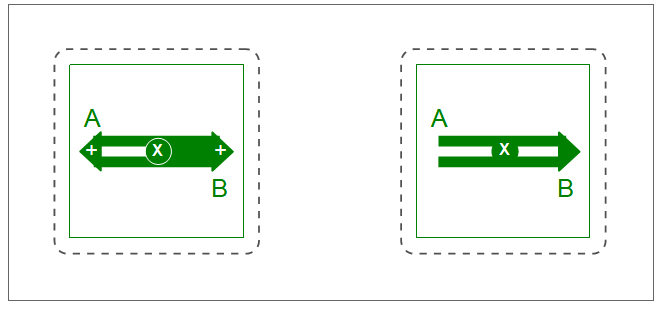
The display is "broken" and looks rather ugly. Unfortunately, there are even worse examples.
What can be done about this?
Regards,
Guido
EDIT:
While the above is a minimal example, I feel like giving more explicit examples to demonstrate, that the display of diagrams (i.e. SystemModel["model"]["Diagram"] ) in its present form is rather completely useless:
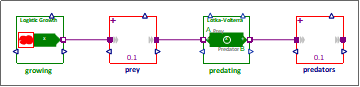
Example1 (WSM Model Center):
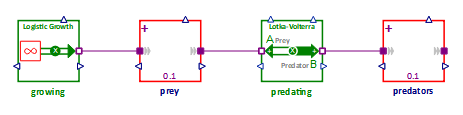
Example1 (Mathematica):
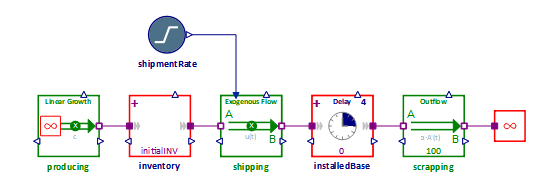
Example2 (WSM Model Center):
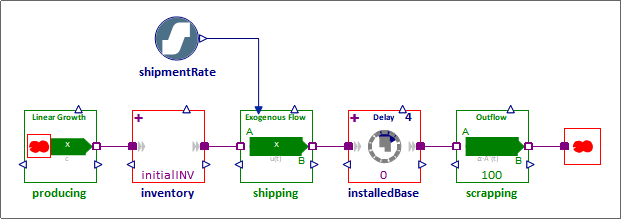
Example2 (Mathematica):
 Attachments:


