I have a list of values:
{1, 1, 1, 3, 4, 4, 4, 3, 3, 3, 3, 4, 15, 23,...}
I want to plot the items, but I want the colour of each item to be determined by its value. What's the most 'Wolfram' way of doing this?
Cheers Andy
Hi Arnoud, I wasn't thinking of ColorFunction, but only because I didn't know about it! Thank you for the suggestions. I learn about at least two new functions every time I ask a question.
You mean by using ColorFunction?
ColorFunction
ListPlot[
 RandomInteger[100, 20],
 ColorFunction -> "Rainbow"
 ]
Here is one way to do it.
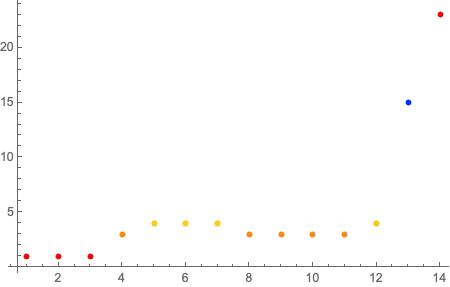
data = {1, 1, 1, 3, 4, 4, 4, 3, 3, 3, 3, 4, 15, 23};
data // Map[Style[#, Hue[Rescale[#, MinMax[data]]]] &] // ListPlot[#, PlotRange -> All] &
Thanks, that gives me exactly what I was looking for. I didn't realise that I could wrap data points in functions, inside a list, and have those functions evaluated by the ListPlot function. Cheers Andy