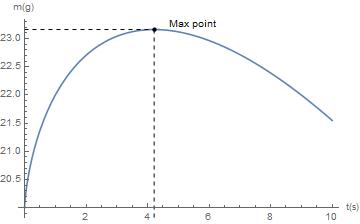
I'm trying to get the following output:
The respective code is the following:
regData = {
   c1 -> Quantity[5.00, "Grams"/("Seconds")^(8/10)],
   c2 -> Quantity[-3.00, "Grams"/"Seconds"],
   c3 -> Quantity[20.00, "Grams"]
   };

m[t_] := (c1 t^(8/10) + c2 t + c3) /. regData;

grf1 = Plot[
   Evaluate[m[t] 10^3], {t, Quantity[0., "Seconds"],
    Quantity[10., "Seconds"]}, AxesLabel -> {"t(s)", "m(g)"}];

sol1 = Solve[m'[t] == 0, t] // Flatten;

ti = 0;
tf = QuantityMagnitude[t /. sol1];
mi = 0;
mf = QuantityMagnitude[m[t] /. sol1];

grf2 = Graphics[{Dashed, Line[{{ti, mf}, {tf, mf}}]}];
grf3 = Graphics[{Dashed, Line[{{tf, mi}, {tf, mf}}]}];
grf4 = Graphics[{PointSize[Medium], Point[{tf, mf}]}];
grf5 = Graphics[Text["Max point", {1.3 tf, 1.004 mf}]];

Show[grf1, grf2, grf3, grf4, grf5]
Things are almost perfect, except by the "10^3" in the content of "grf1" symbol. This number must be included in the code in order to maintain the unit "Grams" working. Can someone give some tip about solving this problem?
I read few posts about using units in a graph created by Plot, especially the "Plot functions of Quantities with Units?", posted by Eric Hudson in this community. I'm hopping that something new and easy has arised to solve problems like this.


