Message Boards Message Boards

Is this a bug with GraphicsGrid?

Hi! I am trying to reproduce a GraphicsGrid to visualize data as follows:

ofdata = ExampleData[{"Statistics", "OldFaithful"}];
GraphicsGrid[{
  {ListPlot[ofdata], DensityHistogram[ofdata, 20, "PDF"]},
  {Histogram3D[ofdata, 20, "PDF"], SmoothHistogram3D[ofdata]}
  }, ImageSize -> 400]

But the result was not the expected since the first ListPlot graphic was not shown (see figure below)
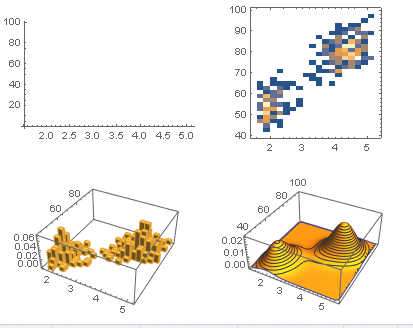
enter image description here

If I make the ListPlot isolated I success

ListPlot[ofdata]
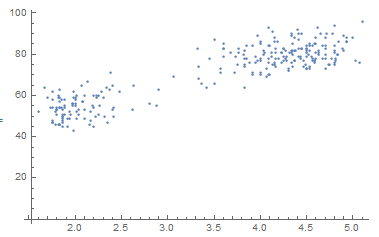
enter image description here

I have Mathematica Version 12.1.1. I don't know why this happens, is this a bug?.

Thanks for your comments!

POSTED BY: Diego Ramos
4 Replies

Hi Diego

I evaluated your original code and got the expected output, I am running Wolfram Desktop V12.1.1 on Windows 10 Pro, so I guess it is related to your system. enter image description here

POSTED BY: Ahmed Elbanna

Hi Ahmed

Oh I see! This allows me to suspect that it is my system. Thanks!

POSTED BY: Diego Ramos

If you couldn't figure it out, you can always contact technical support http://www.wolfram.com/support/contact

POSTED BY: Ahmed Elbanna

I observe that size I related with the problem. If I change the size I obtain the expected result.

GraphicsGrid[{
  {ListPlot[ofdata], DensityHistogram[ofdata, 20, "PDF"]},
  {Histogram3D[ofdata, 20, "PDF"], SmoothHistogram3D[ofdata]}
  }, ImageSize -> Large]

enter image description here

POSTED BY: Diego Ramos
Reply to this discussion
Community posts can be styled and formatted using the Markdown syntax.
Reply Preview
Attachments
Remove
or Discard

Group Abstract Group Abstract