Message Boards Message Boards

Arrows between events in causal graphs that skip over other events

Posted 3 years ago

Does anyone know the reason why the causal graphs show some but not all arrows between updating events that skip over a step? What do the arrows signify?

I put numbers 1-5 on the arrows in this graph from https://www.wolframphysics.org/technical-introduction/the-updating-process-in-our-models/causal-graphs-for-causal-invariant-rules/#p-319 that skip steps. Why these arrows and not other arrows that could have been drawn that would also skip steps?

graph

POSTED BY: Joseph Musser
9 Replies
Posted 3 years ago

That is a helpful explanation, and it answers my original question perfectly. Thanks so much for taking the time!

POSTED BY: Joseph Musser

Hi,

I think you will have probably figured out by now, but maybe this could be helpful to others. As explained here https://wolframphysics.org/technical-introduction/the-updating-process-for-string-substitution-systems/events-and-their-causal-relationships/, there is an orange arrow between event A and B if and only if all or part of the input of event B was in the output of event A. It is quite difficult to see that in the graph you posted, because the pictures of the events are small and it isn't easy to understand what is going on.

I suggest you take a look at this graph: string substitution graph

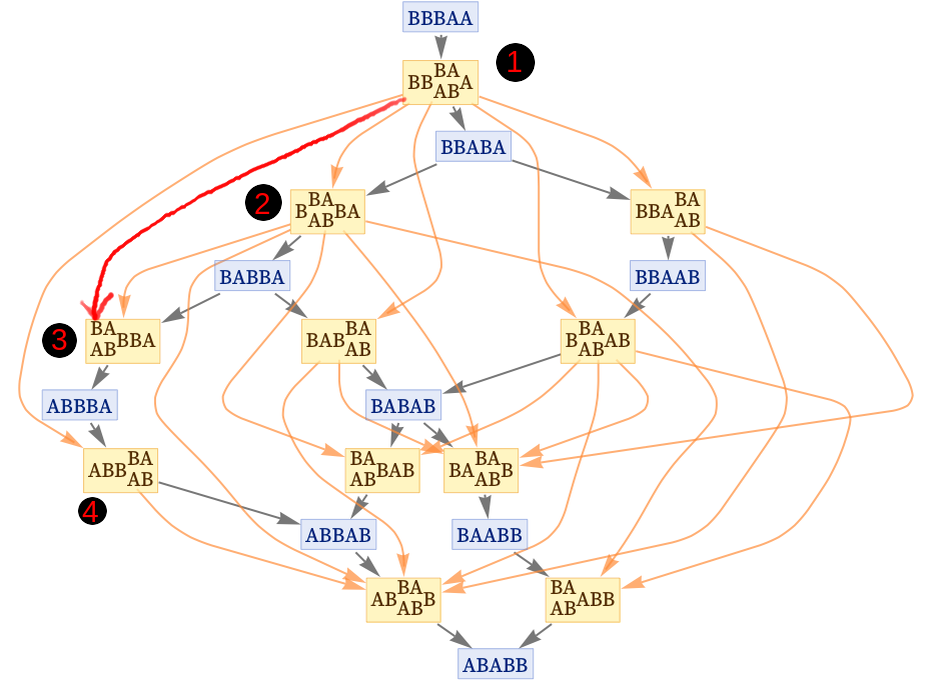
It is taken from https://wolframphysics.org/technical-introduction/the-updating-process-for-string-substitution-systems/the-significance-of-causal-invariance/ and has the advantage of being a string substitution system, so it is easier to visualize.

The rule here is simply AB $\rightarrow$ BA. Look at the leftmost path where I have numbered the events. The red connection between event 1 and event 3 (which I added) is not correct and should not be present, because none of the first two letters of the string BABBA (which are used as input of event 3) are created by event 1. In fact, the first B (BABBA) was present in the initial state and the A (BABBA) was created by event 2.

Conversely, look at event 4. The input of this event are the last two letters of ABBBA. The last A (ABBBA) comes from the initial state, while the B (ABBBA) was indeed created by event 1. Therefore, since part of the input of event 4 was created by event 1, there must be an orange arrow connecting 1 to 4.

The exact same principle can be applied to the graph that you posted, but it is more difficult to see. If you are not convinced, I suggest you try and draw part of your graph by hand. With some time, you could work out what are the inputs and outputs of each event, and where each node and arc have originated. You should be able to see why the red connections you have drawn are incorrect.

Hope this helps

POSTED BY: Ruggero Valli
Posted 3 years ago

I think the answer is that those rules did not lead to the new state. But, proving that would take more time than I have right now.

I will try to find some time this week to dive into this a bit more. This is a fascinating topic.

POSTED BY: Mike Besso
Posted 3 years ago

I think I'm the one missing something, but I'm still just trying to understand this. Why aren't there orange arrows here where I've added red lines? (There are more I could draw.)

enter image description here

POSTED BY: Joseph Musser
Posted 3 years ago

For this number of iterations, I do not see any missing orange arrows. Am I missing something?

POSTED BY: Mike Besso
Posted 3 years ago

Yes, so why aren't there more of these orange arrows? What makes the five that are there more significant than other arrows you could draw that point to future events caused by each event?

POSTED BY: Joseph Musser
Posted 3 years ago

I think that the orange arrows point to all future events that are caused by this event, not just the immediate next event.

POSTED BY: Mike Besso
Posted 3 years ago

Thanks! I should have clarified that I'm only asking about the orange arrows. There are orange arrows from each updating event to each immediately-following updating event, as you'd expect, but there are also five orange arrows that connect to events that don't immediately follow, jumping ahead if you will. More such arrows seem to be possible, so why only those five, and why those five at all?

POSTED BY: Joseph Musser
Posted 3 years ago

I'm just getting started with Wolfram Physics and really wish I had more time to experiment. Taking a look at your example though, I think (and am by no means certain) that the diagram is showing two separate graphs.

The gray arrows take us from one state to the next state after the application of the rules.

The orange arrows show us what events lead to all future events, not just the next event.

I'd love to hear other interpretations.

POSTED BY: Mike Besso
Reply to this discussion
Community posts can be styled and formatted using the Markdown syntax.
Reply Preview
Attachments
Remove
or Discard

Group Abstract Group Abstract