Ok, here comes at least an approach to read in the data from you statistical site: First I download and unzip sh_statbel_statistical_sectors_20200101.shp.zip - this creates a directory where you can find sh_statbel_statistical_sectors_20200101.shp which can be imported:
ClearAll["Global`*"]
SetDirectory[NotebookDirectory[]];
fnSHP = "sh_statbel_statistical_sectors_20200101.shp/sh_statbel_statistical_sectors_20200101.shp";
Import[fnSHP, "Elements"]
(*  Out:  \
{"Centering","CentralScaleFactor","CoordinateSystem",\
"CoordinateSystemInformation","Data","Datum","Graphics",\
"GraphicsList","GridOrigin","InverseFlattening","LayerNames",\
"LayerTypes","LinearUnits","Projection","ProjectionName",\
"ReferenceModel","SemimajorAxis","SemiminorAxis","SpatialRange",\
"StandardParallels"}  *)
so all sort of interesting things can be extracted:
Import[fnSHP, "CoordinateSystemInformation"]
(*  Out:   \
"PROJCS"\[Rule]{"Belge_Lambert_1972","GEOGCS"\[Rule]{"GCS_Belge_1972",\
"DATUM"\[Rule]{"Belge_1972","SPHEROID"\[Rule]{"International_1924",6.\
378388`*^6,297.`}},"PRIMEM"\[Rule]{"Greenwich",0.`},"UNIT"\[Rule]{\
"Degree",0.0174532925199433`}},"PROJECTION"\[Rule]{"Lambert_Conformal_\
Conic_2SP"},"PARAMETER"\[Rule]{"False_Easting",150000.013`},\
"PARAMETER"\[Rule]{"False_Northing",5.400088438`*^6},"PARAMETER"\
\[Rule]{"Central_Meridian",4.36748666666667`},"PARAMETER"\[Rule]{\
"Standard_Parallel_1",51.1666672333333`},"PARAMETER"\[Rule]{"Standard_\
Parallel_2",49.8333339`},"PARAMETER"\[Rule]{"Latitude_Of_Origin",90.`}\
,"UNIT"\[Rule]{"Meter",1.`}}  *)
or:
graphics = Import[fnSHP, "Graphics"]
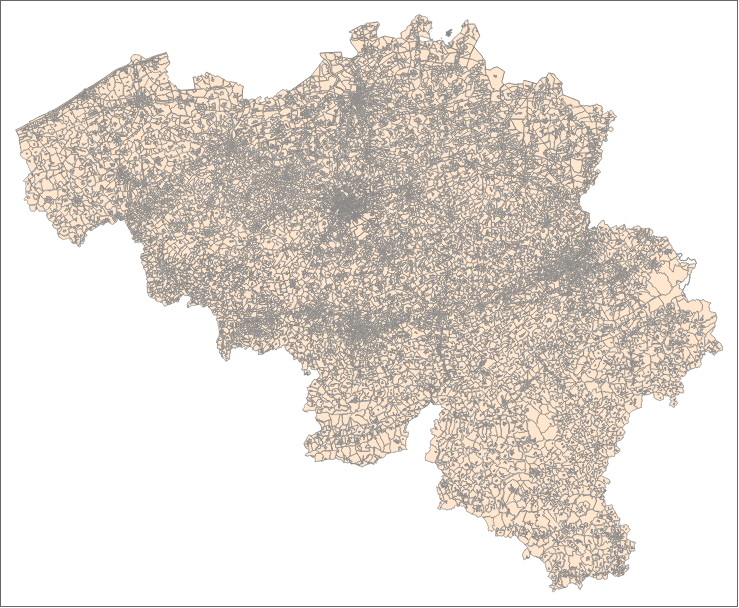
Here we see 19794 polygons.
Reading in the full data:
dataSHP = First@Import[fnSHP, "Data"];
dataSHP // Shallow
(*  Out:  \
{"LayerName"\[Rule]"sh_statbel_statistical_sectors_20200101",\
"Geometry"\[Rule]{\[LeftSkeleton]19794\[RightSkeleton]},"Labels"\
\[Rule]{\[LeftSkeleton]29\[RightSkeleton]},"LabeledData"\[Rule]{\
\[LeftSkeleton]29\[RightSkeleton]}}  *)
and in particular the polygons, the labels and the respective labeled data:
polygs = "Geometry" /. dataSHP;
labels = "Labels" /. dataSHP;
labeledData = "LabeledData" /. dataSHP;
And like so one can see what is meant by the latter
Shallow /@ labeledData
Hopefully this is more helpful, regards -- Henrik


