Message Boards Message Boards

Evaluation of a predict model for values of outside of used data?

Dear all,

How do I evaluate this model for other values for x. If x=1.2, then what will be the value of y?

y = {0.44, 0.33, 0.3, 0.3, 0.32, 0.34, 0.4, 0.53, 0.68, 0.83};

x = {0.04`, 0.08`, 0.12`, 0.16`, 0.2`, 0.24`, 0.32`, 0.48`, 0.64`, 
   0.8`};

tuples = Thread[Transpose[{x}] -> y];

train = Take[tuples, 7];

test = Take[tuples, -3];

cfunc = Predict[train, Method -> "NeuralNetwork", 
   PerformanceGoal -> "Quality"];

(* y predicted for training data *)

yptrain = Map[cfunc, train[[All, 1]]];

(* y predicted for testing data *)

yptest = Map[cfunc, test[[All, 1]]];

(* y observed for testing data *)
POSTED BY: M.A. Ghorbani
11 Replies

I am impressed by the use of NN here, and maybe this is a bit off topic, but I would like to make a soft-spoken remark: When nothing more than an extrapolation is wanted, a simple fit will do it, e.g.:

ClearAll["Global`*"]
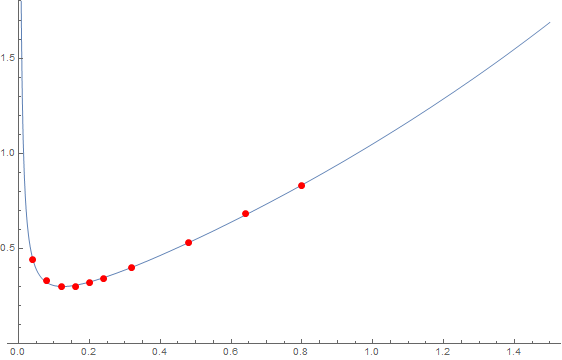
ydata = {0.44, 0.33, 0.3, 0.3, 0.32, 0.34, 0.4, 0.53, 0.68, 0.83};
xdata = {0.04, 0.08, 0.12, 0.16, 0.2, 0.24, 0.32, 0.48, 0.64, 0.8};
data = Transpose[{xdata, ydata}];
model = (a + b x + c x^2)/(d x + e x^2);
fit = FindFit[data, model, {a, b, c, d, e}, x];
Plot[{Evaluate[model /. fit]}, {x, 0, 1.5}, Epilog -> {Red, PointSize[Large], Point[data]}, PlotRange -> {0, 1.8}]

enter image description here

POSTED BY: Henrik Schachner

Hello!

I don't like much black boxes too, but I think the origin of the problem lies in the way training and test sets were built. Defining

train = RandomSample[tuples, 7];
test = Complement[tuples, train];

and plotting the prevision

ListPlot[{Map[Flatten@Apply[List, #] &, train], 
  Map[Flatten@Apply[List, #] &, test], 
  Transpose[{{0.27, 0.9, 1, 1.1, 1.2, 1.3, 1.4, 1.5}, yPredictions}]},
  PlotStyle -> {Black, Green, Red}, 
 PlotLegends -> {"Training data", "Test data", "Predictions"}]

you should obtain something correct.

POSTED BY: Claude Mante

Claude,

Thank you so much for the interesting solution.

With a random set for training and testing dataset and using commands such as Do or any other loop command, it is possible to determine the best training and testing dataset, e.g. based on root mean square error or even correlation coefficient?

POSTED BY: M.A. Ghorbani
Posted 3 years ago

Hi Mohammad,

Using a simple neural network will generate a much better fit than Predict with Method -> "NeuralNetwork".

y = {0.44, 0.33, 0.3, 0.3, 0.32, 0.34, 0.4, 0.53, 0.68, 0.83};
x = {0.04, 0.08, 0.12, 0.16, 0.2, 0.24, 0.32, 0.48, 0.64, 0.8};

points = Transpose[{x, y}];
trainingData = Rule @@@ points;

net = NetChain[{32, Tanh, 1}]
trained = NetTrain[net, trainingData]

Show[
 ListPlot[points, PlotLegends -> LineLegend[{"Data"}]],
 Plot[trained[x], {x, 0, .8}, PlotLegends -> LineLegend[{"Trained"}]],
 Plot[trained[x], {x, 0.8, 1.2}, PlotStyle -> Red, PlotLegends -> LineLegend[{"Extrapolated"}]],
 PlotRange -> All]

enter image description here

But, as @Jim Baldwin said "Don't extrapolate with black box functions". If you have a model that you expect the data to follow, try fitting.

POSTED BY: Rohit Namjoshi

Thank you so much, Rohit.

How do I evaluate the error or accuracy of this network for training and test data?

y = {0.44, 0.33, 0.3, 0.3, 0.32, 0.34, 0.4, 0.53, 0.68, 0.83};
x = {0.04, 0.08, 0.12, 0.16, 0.2, 0.24, 0.32, 0.48, 0.64, 0.8};

points = Transpose[{x, y}]

data = Rule @@@ points

train = Take[data, 7]
test = Take[data, -3]

net = NetChain[{32, Tanh, 1}]

trained = NetTrain[net, train]
POSTED BY: M.A. Ghorbani
Posted 3 years ago

With such a small dataset, excluding 30% from training is likely to produce worse results. You can evaluate the deviations at each x value and then compute StandardDeviation or whatever metric you want.

trained = NetTrain[net, trainingData]
deviations = y - trained[x];
StandardDeviation@deviations

To train on a subset

{train, test} = ResourceFunction["TrainTestSplit"][trainingData, "TrainingSetSize" -> Scaled[.7]];
trained = NetTrain[net, train]

Use the test subset to evaluate the quality of the model

measurements = 
 NetMeasurements[trained, test, 
   {"StandardDeviation", "MeanDeviation", "RSquared", "MeanSquare"}]
POSTED BY: Rohit Namjoshi
Posted 3 years ago

A wonderful solution. Thank you, Rohit.

How to get network output (simulated data) in a list for the train and test data?

POSTED BY: Alex Teymouri
Posted 3 years ago

Hi Alex,

Unless you have a much larger dataset I would not split it into train / test. The results are much worse compared to using all of the data, and will be very sensitive to the random selection. I did not call SeedRandom before the random split, so your results will probably be very different.

predictOnTrained = MapAt[trained[#] &, train, {All, 2}]
predictOnTest = MapAt[trained[#] &, test, {All, 2}]

ListPlot[{points, List @@@ predictOnTrained, List @@@ predictOnTest},
 PlotLegends -> {"Data", "Train Predictions", "Test Predictions"},
 PlotStyle -> ColorData[112]]

enter image description here

POSTED BY: Rohit Namjoshi
Posted 3 years ago

I updated my previous response by adding in the prediction for x=0.27. But I get 0.369748. (I'm using Mathematica 12.2.)

POSTED BY: Jim Baldwin
Posted 3 years ago

You might not like the values but to get values just do what you did for predicting the test and training values:

yPredictions = Map[cfunc, {{0.27}, {0.9}, {1}, {1.1}, {1.2}, {1.3}, {1.4}, {1.5}}]
ListPlot[{Transpose[{x[[1 ;; 7]], y[[1 ;; 7]]}], 
  Transpose[{x[[8 ;; 10]], y[[8 ;; 10]]}], 
  Transpose[{{0.27, 0.9, 1, 1.1, 1.2, 1.3, 1.4, 1.5}, yPredictions}]},
  PlotStyle -> {Black, Green, Red}, PlotLegends -> {"Training data", "Test data", "Predictions"}]

Test data, training data, and predictions

This is non-Mathematica advice: Don't extrapolate with black box functions.

POSTED BY: Jim Baldwin

Jim, Thank you for your help and advice,

For x=0.27 the below solution is correct?

 y = Map[cfunc, {{0.27}}]

  {0.362546}
POSTED BY: M.A. Ghorbani
Reply to this discussion
Community posts can be styled and formatted using the Markdown syntax.
Reply Preview
Attachments
Remove
or Discard

Group Abstract Group Abstract