Message Boards Message Boards

0
|
2723 Views
|
5 Replies
|
5 Total Likes
View groups...
Share
Share this post:

Mislabeled elements in ListPlot?

Posted 3 years ago

Hello!
I have a nested table stocks with a dimension {8,9,1000,2} so I have 89 different data set that I want to plot. Let say, 8 is the number of business sectors, 9 is the total number of companies selected from each sector, and 10002 the change in stock price in 1000 days. I also have the list of the names of the 8 different sectors called sectorNames. I want to ListPlot the first company of each sector, and label the graph of the company by the name of the sector:

ListPlot[stocks[[;;]][[1]],PlotLegends->sectorNames]

The plot works but the graphs are mislabeled. How can I fix this issue?

POSTED BY: Amir Sadeghi
5 Replies

Amir,

I did not realize that your companies operate in every sector.

Comment #1: you never need the [[;;]] in any of the plot commands. I copied them from your post but they are unnecessary.

Comment #2: Here is the answer but now you will see why Dataset[] is significantly easier to understand. You need to transpose your dimensions in order to change from plotting by sector to plotting by company:

s = 1;
ListPlot[Transpose[stocks, 1 <-> 2] [[s]], 
 PlotLegends -> sectorNames, PlotLabel -> companyNames[[s]]]

enter image description here I swapped the first and second dimensions so you can use the earlier posted syntax to plot what you want.

If you don't have many plots to do, the Transpose is ok but if you need to do more complex queries it can be problematic and you should use Dataset.

Regards,

Neil

POSTED BY: Neil Singer
Posted 3 years ago

Dear Neil,

Thanks for your advice on how to post on the forum. I found your suggestion about using the Dataset really helpful. What I wanted to was to plot the data of the first company in each sector; something like this

sectorNames = {"aaa","bbb","ccc"}; 
companyNames = {"smallest", "largest"};
i=0;
stocks = 
 Table[Table[i += 5; 
   Table[{n, RandomReal[{i, i + 1}]}, {n, 25, 1000, 1}], {company, 
    companyName}], {sec, sectorNames}];

I want to plot the data of the smallest company in each sector and tag its graph with the name of the sector. If I use the following code

s = 1;
ListPlot[stocks[[ ;; ]][[s]], 
PlotLegends -> companyNames]

to plot, then I only get two graphs, not three.

POSTED BY: Amir Sadeghi

Amir,

First, You should always post an example that actually runs and duplicates the problem.

You are mixing up the structure. You are sending company data to plot but trying to label the data with sector names

I took your code and made a running example so you can see the issue.

i = 0; stocks = 
 Table[Table[i += 5; 
   Table[{n, RandomReal[{i, i + 1}]}, {n, 25, 1000, 1}], {company, 
    companyNames[sec]}], {sec, sectorNames}];

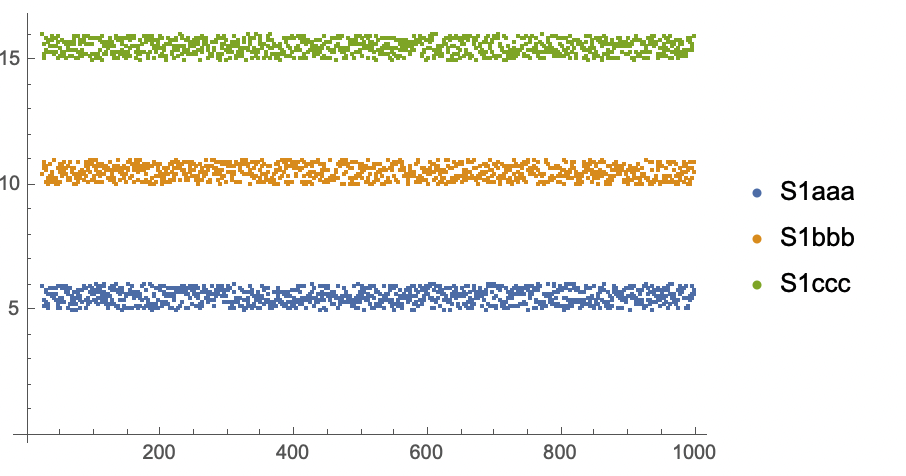
s = 1; ListPlot[stocks[[s]], 
 PlotLegends -> companyNames[sectorNames[[s]]]]

s = 2; ListPlot[stocks[[s]], 
 PlotLegends -> companyNames[sectorNames[[s]]]]

which gives a plot like this: enter image description here If you intended to plot sectors and not companies, how do you take the data for, say 3 companies, and plot that as one sector? Is it three separate curves with the same color? three curves different colors?
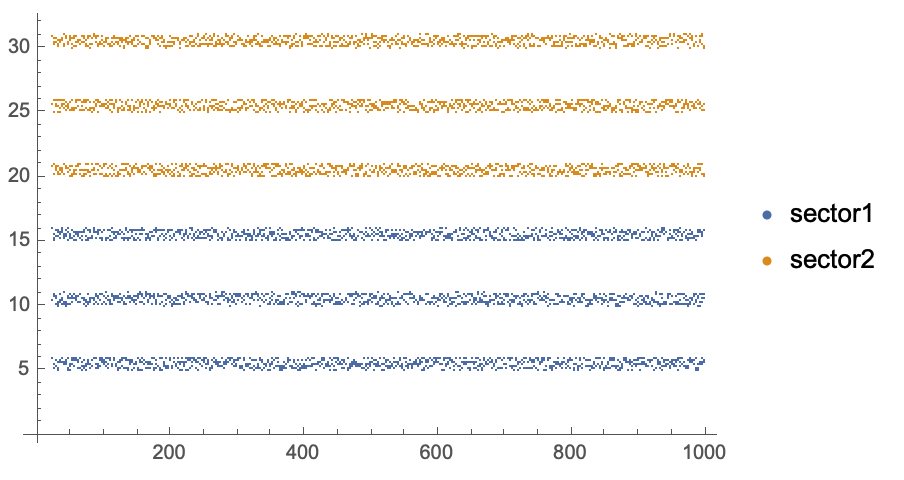
Maybe this?

ListPlot[Map[Flatten[#, 1] &, stocks], 
 PlotLegends -> sectorNames]

enter image description here

My recommendation is for you to look at using Dataset] for your stocks [(documentation here). Then you can make queries like get all the stocks is a certain sector. Your plotting commands will become less cryptic.

Regards,

Neil

POSTED BY: Neil Singer
Posted 3 years ago
stocks = Table[Table[Table[{n, 
      b /. FindRoot[
        stockSimulator[company, sec, 1, b, n] == 0, {b, 3}]}, {n, 25, 
      1000, 1}], {company, companyNames}], {sec, sectorNames}];

According to the way I defined the nested list above, the stocks has a dimension {8,9,1000,2} and the outer list with 8 submit is the sectorNames. As a result, when I plot

ListPlot[stocks[[;;]][[1]],PlotLegends->sectorNames]

I should have the name of sector as the legends for the plots with the same order as the order they are used in the stocks. However, this is not the case and the legends does not match the graph names.

POSTED BY: Amir Sadeghi
Posted 3 years ago

In what way are they "mislabeled"? ListPlot will create a legend using the values provided in PlotLegends. The order must match the order of the data.

POSTED BY: Rohit Namjoshi
Reply to this discussion
Community posts can be styled and formatted using the Markdown syntax.
Reply Preview
Attachments
Remove
or Discard

Group Abstract Group Abstract