Group Abstract Group Abstract

Message Boards Message Boards

[WSG21] Daily Study Group: Building and Applying Epidemic Models

A new study group for Building and Applying Epidemic Models with the Wolfram Language begins Monday, May 10, 2021!

Making progress in an online course can be daunting when you have to study all alone. Join a cohort of fellow Wolfram Language users for a two-week study group in which you will start in week one with the basics of implementing compartment-based epidemiological models in the Wolfram Language. In the second week, you will cover multi-group models–taking into account vital demographics (i.e. birth, death) and age groups–in addition to introducing control measures and ending with stochastic models.

Sign up here: https://wolfr.am/UZfPoLAq

55 Replies

I just register up for this course!
Where can I download the course series notebook file?

POSTED BY: Tsai Ming-Chou
Posted 4 years ago

Dear Dr. Robert, Greetings and thanks to you for every help and recommendation you did. I wonder regarding the function "DiseaseFreeEquilibirium" it seems not available and the font remains in blue. Once I used the next-generation method function to evaluate the controlled reproduction number for my vaccinated model will run forever without reaching any output! So how to define the equilibrium point in our calculation using your wonderful packages? I followed the same as you did in your session for "Host-Vector Models Treatment and Vaccination Models" Thanks and regards

Attachments:
POSTED BY: Manal Almuzini
Posted 4 years ago

Hi Mr. Jeremy, Thanks for your feedback. Really I did via Dr. Robert's package, but it seems something went wrong or I missed some critical point if you could guide me? This is the screenshot. Maybe because I used the vital demographic as well? Regards.

Attachment

Attachments:
POSTED BY: Manal Almuzini
Posted 4 years ago

Greetings Mr. Jeremy, Greetings... in session2 notebook, how can the "Graph formatting" code at the end of the notebook be modified to include the natural death rate from each compartment, and the death rate from the infected compartment also? (infected compartment includes t outflow: the natural death rate and disease mortality rate.

ClearAll[gstyle,makeEpiModelGraph,imakeEpiModelGraph];
gstyle[str_] := Style[str, Black, 18]
makeEpiModelGraph[info:{Rule[_DirectedEdge, _String]..}] := Block[
    {edges, g},
    edges = info[[All,1]];
    g = imakeEpiModelGraph[info, edges, Left];
    If[!Less@@Subtract@@(MinMax/@Transpose@(VertexCoordinates /. AbsoluteOptions[g, VertexCoordinates])),
       imakeEpiModelGraph[info, edges, Top],
       g
    ]
]
imakeEpiModelGraph[info_:None, edges:_DirectedEdge|{_DirectedEdge..}, orientation_:Top] := Graph[
       edges,
       VertexShapeFunction-> Function[{xy, v, wh}, Inset[Framed[gstyle[v], Background->LightBlue], xy]],
       EdgeLabels -> (info /. Rule[edg_, str_String] :> Rule[edg, Placed[gstyle@str, .5]]),
       PerformanceGoal->"Quality",
       ImageSize->450,
       GraphLayout->{"LayeredDigraphEmbedding","RootVertex"->"\[ScriptCapitalS]","Orientation"->orientation}
    ]

Thanks and regards

POSTED BY: Manal Almuzini
Posted 4 years ago
POSTED BY: Manal Almuzini
POSTED BY: Robert Nachbar
Posted 4 years ago
POSTED BY: Manal Almuzini
Posted 4 years ago

Thanks a lot for your clarifications, recommendations, and prompt response. Regards

POSTED BY: Updating Name

The Automatic method used in the NextGenerationMatrix function sets the derivatives in the differential equations to 0 and then solves for the model variables. This gives all the equilibria, and then the one with the infectious compartments equal to 0 is selected.

It works quite well for simple models, but can take a very long time for larger models. That's why I implemented the "DiseaseFreeEquilibrium" option. I need to find a more efficient automatic method, and one idea I had was to set the force of infection to 0 and then solve for the equilibria in the usual way.

When the state fo the infectious individual affects the transmission rate, then one still uses a single force of infection in the model and also specifies different infectivities for the infectious compartments. So, for your model use this transition:

Transition[\[ScriptCapitalS], \[Beta] \[Lambda][t], \[ScriptCapitalE]]

and this option:

ForceOfInfection -> {{\[Lambda], {{\[ScriptCapitalA], q}, {\[ScriptCapitalI], 1}}, 
{"Standard", Automatic}}}

The resulting force of infection is:

{\[Lambda][t] -> (q \[ScriptCapitalA][t] + \[ScriptCapitalI][t])/
(V[t] + \[ScriptCapitalA][t] + \[ScriptCapitalE][t] + \[ScriptCapitalI][t] + \[ScriptCapitalR][t] + 
\[ScriptCapitalS][t])}

which I believe is what you are after.

POSTED BY: Robert Nachbar
Posted 4 years ago
Attachments:
POSTED BY: Manal Almuzini
POSTED BY: Robert Nachbar
Posted 4 years ago
Attachments:
POSTED BY: Manal Almuzini
POSTED BY: Robert Nachbar
Posted 4 years ago

Is there a way I can default any .nb attachments to "not preview" to avoid cluttering the Forum? Or should they either be shorter, not sent and sent elsewhere?

POSTED BY: Peter Aptaker

Yes Peter, you can attach a notebook file without preview using the button "Add a file to this post" located at the end of the editor as shown in the below image. You can also publish a notebook in cloud and provide the link. enter image description here

POSTED BY: Ahmed Elbanna
Posted 4 years ago

Sorry, I thought that is how I had attached my two .nb that are cluttering the forum

POSTED BY: Peter Aptaker

The thread is fast and works fine with me. Feel free to use the feature that suits you best.

POSTED BY: Ahmed Elbanna

Thank you, I'll make the correction.

POSTED BY: Robert Nachbar
Posted 4 years ago
POSTED BY: Manal Almuzini

Hi!

It appears that you are using \[RightArrow], or <esc> -><esc>, instead of \[Rule], or ->, for the options to the functions, and that that's why the functions are not evaluating. There a great many instances of this problem in the notebook, and they have to be fixed one-by-one because using Edit > Find with ReplaceAll will also change the transitions that do use the right arrow character.

The format for the values of some of the options for DynamicTransmissionModel are a bit complex, and I'm addressing that by writing much better documentation in symbol reference pages, but they are not ready yet. The option

ForceOfInfection -> {\[Lambda], Subscript[\[ScriptCapitalI], a], 
  Subscript[\[ScriptCapitalI], s] {"Standard", Automatic}}

is missing a pair of curly braces and a comma, and should be coded this way

ForceOfInfection -> {\[Lambda], {Subscript[\[ScriptCapitalI], a], 
   Subscript[\[ScriptCapitalI], s]}, {"Standard", Automatic}}

I pushed a new version of both packages to the Cloud over the weekend, and one of the changes renamed the CompartmentalModelGraph option VertexColor to CompartmentColors to avoid confusion with the Polygon option VertexColors.

POSTED BY: Robert Nachbar
Posted 4 years ago
POSTED BY: Manal Almuzini

There are two errors in the input:

vitalModelData = 
 DynamicTransmissionModel[model, t, 
  ForceOfInfection -> {\[Lambda], \[ScriptCapitalA], \
\[ScriptCapitalI], {"Standard", Automatic}}, 
  BirthCompartments \[RightArrow] \[ScriptCapitalS]]

The first is that the infectious compartments need to be in a list by themselves, and the second is that there was one more \[RightArrow] in the last option. This code works:

vitalModelData = 
 DynamicTransmissionModel[model, t, 
  ForceOfInfection -> {\[Lambda], {\[ScriptCapitalA], \
\[ScriptCapitalI]}, {"Standard", Automatic}}, 
  BirthCompartments -> \[ScriptCapitalS]]

By the way, are you working in a notebook on the desktop or in the Wolfram Cloud? I'm wondering if there is something I should do to make it just as easy to work in either environment.

POSTED BY: Robert Nachbar
Posted 4 years ago

Thanks for your feedback. I am working on a notebook on the desktop, not in the Wolfram Cloud. Is it better to use the Wolfram cloud? If so, I will do that. Regards

POSTED BY: Manal Almuzini
Posted 4 years ago
Attachment

Attachments:
POSTED BY: Manal Almuzini

The option for the birth compartments is still using \[RightArrow] instead of \[Rule]. If you add //Hold//FullForm to the end of the line and evaluate it you can see that \[RightArrow] is getting interpreted as Transition:

In[18]:= DynamicTransmissionModel[model, t, ForceOfInfection -> {\[Lambda], 
{\[ScriptCapitalA], \[ScriptCapitalI]}, {"Standard", Automatic}}, 
BirthCompartments \[RightArrow] \[ScriptCapitalS]] // Hold // FullForm

Out[18]//FullForm= Hold[DynamicTransmissionModel[model, t, Rule[ForceOfInfection, 
List[\[Lambda], List[\[ScriptCapitalA], \[ScriptCapitalI]], List["Standard", Automatic]]], 
Transition[BirthCompartments, \[ScriptCapitalS]]]]

Regarding the working environment, I find using the desktop much more convenient that the Cloud, specially when I use a lot of typeset expressions for input.

POSTED BY: Robert Nachbar
Posted 4 years ago

Dear Dr. Nachbar, Greetings. Thanks for your continuous help and support, for my model SVEAIRS including vital demographic and vaccination, I wonder regarding the treatment model data give an output percentage as shown? moreover, the ngm command gives me an error as well? any comments or suggestions? Thanks again and regards

Attachments:
POSTED BY: Manal Almuzini
Posted 4 years ago

In Host-Vector Models, Malaria is not a bacterium but a protozoa

POSTED BY: Doug Beveridge
Posted 4 years ago

Hello All!

Sorry for putting this up here so late, but I noticed an error I've been getting with the first notebook of this series. I don't see a population key for AdmistrativeRegion so perhaps that is why i'm getting the error so these lines of code don't render?

Error I'm Receiving

POSTED BY: Hector Naranjo
Posted 4 years ago
Attachments:
POSTED BY: Peter Aptaker
Posted 4 years ago

It would be excellent if you (Robert N) could comment on this some time (it relates to he previous post)

POSTED BY: Peter Aptaker
POSTED BY: Robert Nachbar
Posted 4 years ago
POSTED BY: Peter Aptaker
Posted 4 years ago

Can you give any analytical insight into "infections/lives saved" as function of vaccine rollout rate? Clearly it is easy, if vaccination is "instant" and I have had success assuming vaccine rollout is far faster than new infections. I appreciate that "lives" is harder that "cases", with age stratification on both vaccine rollout and mortality but that is not my question.

POSTED BY: Peter Aptaker

Computing the number of lives saved, money saved, quality adjusted life years (QALYs) gained, etc. are one of the leading reasons pharmaceutical companies build these epidemiology models. In a nutshell, the model is run without vaccination as the base case, and then for several vaccination strategies (varying age of vaccination, number of doses, assumptions about efficacy, etc.). The health and economics outcomes are computed for each strategy (including no-vaccine) and compared to each other. The results are used to choose the best strategy to propose to regulators (FDA).

The strategies are typically simulated over a 10, 25, 50, or 100 year time horizon because the results are often time-dependent. Sometimes it takes several years for the vaccination program to reach its full effect in a population.

POSTED BY: Robert Nachbar
Posted 4 years ago

I was thinking of Covid19 rollouts, key decisions which need to be made on a much shorter time horizon (e.g. the UK decision to prioritorize first doses and older people). But even then I appreciate the “best” simulation (e.g. with full age stratification ..) is needed.

But my interest is the insight one can get from the simplest models which, in select cases, can even be done on the “back of an envelope”. I have attached and example Notebook, with no “progressing” vaccination.

I am extending for the actual rollout but, so far, it is not accurate rate and/or elegant enough.

POSTED BY: Peter Aptaker
Posted 4 years ago

Has the Stochastic Models video been released ?

POSTED BY: Doug Beveridge
Posted 4 years ago
POSTED BY: Feng Xu

Regarding the force of infection in age-stratified vs unstratified models, the really isn't an omission of the contract rate from the unstratified case. When one writes the transition

Transition[S, \[Beta] \[Lambda][t], I]

the interpretation of the parameter \[Beta] is up to the user, and as was mentioned in the sessions it is often a composition of several effects including probability of transmission and contact rate. If the code inserted a contact rate parameter in the force of infection for the unstratified case

\[Lambda][t] -> m I[t]

then the infection term in the equations would be

\[Beta] m S[t] I[t]

The two parameters would always appear together and a single composite parameter would suffice.

In the age stratified case, a contact matrix is used and the force of infection is

Subscript[\[Lambda], i][t] -> Sum[Subscript[M, i, j] Subscript[I, j][t], {j, nAges}]

and the infection term in the equations would be

\[Beta] Subscript[S, i][t] Sum[Subscript[M, i, j] Subscript[I, j][t], {i, nAges}]

The parameter \[Beta] would appear with different elements of the contact matrix, and a single parameter does not suffice.

It's really a matter of detail about how one wants to model a combination of effects, and of convenience.

POSTED BY: Robert Nachbar
Posted 4 years ago

Post registration (now done 3 times) I land here: https://www.bigmarker.com/series/daily-study-group-building-applying-epidemic-models/series_details but I see no NB links.

POSTED BY: oliver frankel

The series materials are provided daily in the invitation link you get to join the session. You will get them there, but for now, if you have registered here is the link where you can get notebooks. Files for the series

Hopefully, I am not doing something wrong by sharing this.

POSTED BY: Ravi Kiran
Posted 4 years ago

THanks!

POSTED BY: oliver frankel
Posted 4 years ago

Where are the study notebooks, please? I have joined very late....

POSTED BY: oliver frankel

Register here

Then you should be able access the the materials.

POSTED BY: Robert Nachbar
Posted 4 years ago

Hi Ravi,

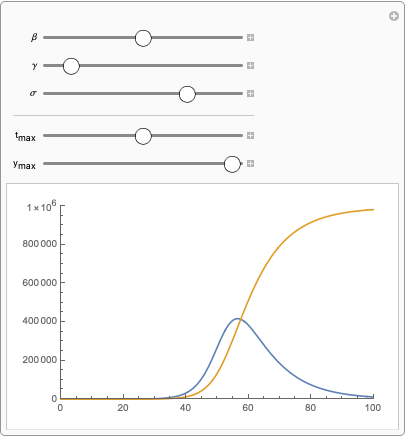
It is easier to pick the solutions you want to plot from the full list. They are in S, E, I, R order, I and R are the third and fourth.

With[{seirSolutions = 
   seirCompartments /. 
    ParametricNDSolve[seirEquations /. seirInitialConditions, seirCompartments, {t, 0, 100000},
    {\[Beta], \[Gamma], \[Sigma]}]}, 
 Manipulate[
  Show[{Plot[
     Evaluate@
      Through[seirSolutions[\[Beta], \[Gamma], \[Sigma]]][[3 ;; 4]], {t, 0, tmax}, 
     PlotRange -> {{0, tmax}, {0, ymax}}]}],
     (*paramters in model*)
     {{\[Beta], 1/2}, 0, 1}, {{\[Gamma], 1/10}, 0, 1}, {{\[Sigma], 3/4}, 0, 1}, 
  Delimiter,
    (*plot range limits*)
   {{tmax, 100, "\!\(\*SubscriptBox[\(t\), \(max\)]\)"}, 0, 200}, 
   {{ymax, 1000000, "\!\(\*SubscriptBox[\(y\), \(max\)]\)"}, 0, 1000000}, 
  SaveDefinitions -> True]]

enter image description here

POSTED BY: Rohit Namjoshi

Thank you so much, Rohit. This works if they are in order right. can I plot if they are not in order, say S and R.

Edit: Okay I got this from wolfram documentation on Part if anyone needs it here it is

POSTED BY: Ravi Kiran

NDSolve and ParametricNDSolve both return lists of Rules. I find it more convenient to work with those lists of Rules than just a list of their Values (right hand sides) as is done in your code. This way I work directly with the variables I need rather than some part of a list. (In general I try to avoid using Part.)

I also find it easier to solve for the variables vi rather than vi[t].

I made a couple changes to your code. In the first cell I used

seirCompartments = {\[ScriptCapitalS], \[ScriptCapitalE], \
\[ScriptCapitalI], \[ScriptCapitalR]};

and in the second cell I used

Plot[{\[ScriptCapitalS][\[Beta], \[Gamma], \[Sigma]][
     t], \[ScriptCapitalR][\[Beta], \[Gamma], \[Sigma]][t]} /. 
   seirSolutions // Evaluate, {t, 0, tmax}, 
 PlotRange -> {{0, tmax}, {0, ymax}}]
Attachments:
POSTED BY: Robert Nachbar

Sir, this might be silly and I am kinda new to Mathematica. I have been a MATLAB and Python user always. When using ParametricNDSolve to solve for solving and plotting, it gives the plot of all the variables S, E, I, and R. I want to vary the parameter using the slider but only focus on the Infection and Recovered compartment. I tried doing it but it showed an error. I am showing what I tried here in the attached notebook. Thank You so much.

POSTED BY: Ravi Kiran

Related to the question asked, I would like to know the following: From c19Data = ResourceFunction["JHUCOVID19VaccineData"][] how do I determine what the keys are, and how do I extract a set of values, for example the time series corresponding to TotalVaccineDosesAllocated?

POSTED BY: Bernardine Wong
Posted 4 years ago

I used

Keys[c19Data ][[1]]

c19Data [[All,{"AdministrativeDivision","TotalVaccineDosesAllocated"}]]
POSTED BY: Doug Beveridge

Thank you. It worked well. If I may trouble you again: I did following your instructions for the ResourceFunction["COVID19EpidemicData"] found in WSG14_Session1.nb but got an unexpected result (as shown in the attachment). What did do wrong?

Attachment

POSTED BY: Bernardine Wong
Posted 4 years ago

Thank you.

POSTED BY: Bernardine Wong
Posted 4 years ago

OK , it seems the menu

Evaluation \Dynamic Updating Enabled

must be enabled (have a tick )

then it loads

POSTED BY: Doug Beveridge
Posted 4 years ago

Hi

The c19Data = ResourceFunction["JHUCOVID19VaccineData"][]

will not load on my machine running Mathematica Desktop. It runs forever then gives a kernal dead error .

When I run it in the cloud , it runs but gives a number of warnings

enter image description here

POSTED BY: Doug Beveridge
Reply to this discussion
Community posts can be styled and formatted using the Markdown syntax.
Reply Preview
Attachments
Remove
or Discard