Message Boards Message Boards

0
|
2374 Views
|
2 Replies
|
0 Total Likes
View groups...
Share
Share this post:

How to dimension a PlotLabel?

Posted 2 years ago

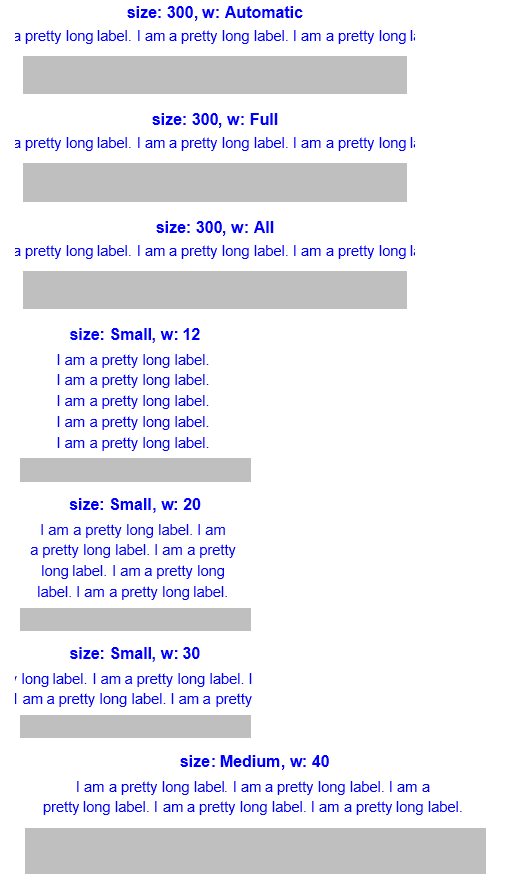
I want to dimension a PlotLabel so that its width matches the desired ImageSize size, i.e. the label is not cut off and is not narrower than necessary.

The PlotLabel usually is a Column that can be sized with ItemSize -> {w, h}. The problem is to determine w appropriately. w = Automatic|Full|All do not work and w cannot be given in graphics coordinates.

w must be specified in ems (but with respect to which font and which font size?). So you would have to know how wide the actual graphic will be, e.g. in points, and then convert that to w. Since I don't know how this could be done, w is explicitly assigned in the following demo code.

Block[{size, w, pl},
  Do[
    {size, w} = sizew;
    pl = Style[Column[{
        Row[{"size: ", size, ", w: ", w}],
        Style[StringRepeat["I am a pretty long label. ", 5], Plain, 11]
        }, Center, ItemSize -> {w, Automatic}]
      , Blue, Bold, 12]; 
    Print[
     Graphics[{FaceForm[GrayLevel[0.75]], 
       Rectangle[{-1, -1/10}, {1, 1/10}]}, PlotLabel -> pl, 
      ImageSize -> size]];
    , {sizew, {{300, Automatic}, {300, Full}, {300, All}, {Small, 
       12}, {Small, 20}, {Small, 30}, {Medium, 40}}}];
  ];

enter image description here

POSTED BY: Werner Geiger
2 Replies

Werner,

You can query the imageSize of the graphic with the ResourceFunction "GraphicsInformation" and use that to set your sizes and then regenerate your graphic with the labels:

Block[{size, w, pl}, Do[{size, w} = sizew;
    pl = 
     Style[
      Column[{Row[{"size: ", size, ", w: ", w}], 
        Style[StringRepeat["I am a pretty long label. ", 5], Plain, 
         11]}, Center, ItemSize -> {w, Automatic}], Blue, Bold, 12]; 
    gr = 
     Lookup[
      ResourceFunction["GraphicsInformation"][
       Graphics[{FaceForm[GrayLevel[0.75]], 
         Rectangle[{-1, -1/10}, {1, 1/10}]}, ImageSize -> size]], 
      "ImageSize"]; Print[gr];
    Print[
     Graphics[{FaceForm[GrayLevel[0.75]], 
       Rectangle[{-1, -1/10}, {1, 1/10}]}, PlotLabel -> pl, 
      ImageSize -> size]];, {sizew, {{300, Automatic}, {300, 
       Full}, {300, All}, {Small, 12}, {Small, 20}, {Small, 
       30}, {Medium, 40}}}];];
POSTED BY: Neil Singer
Posted 2 years ago

Thanks Neil. I think it is clear that even without GraphicsInformation I can draw the Graphics without PlotLabel into a variable g, get AbsoluteOptions[g, ImageSize], use that width to size the PlotLabel and draw the Graphics again including the PlotLabel. Pretty ugly but would work as a bypass.

The underlying problem is that the sizing of Graphics with a PlotLabel is not clear. They seem to influence each other in some not-obvious way. Basicly Mathematica's structure of drawings is too simple. Other Graphic languages differentiate with things like pane, viewport, canvas, frame or the like between the stacked parts of drawings.

A true solution would be an option like PlotLabelSize which could be All, Full, Scaled[..] relative to the Graphics pane size.

POSTED BY: Werner Geiger
Reply to this discussion
Community posts can be styled and formatted using the Markdown syntax.
Reply Preview
Attachments
Remove
or Discard

Group Abstract Group Abstract