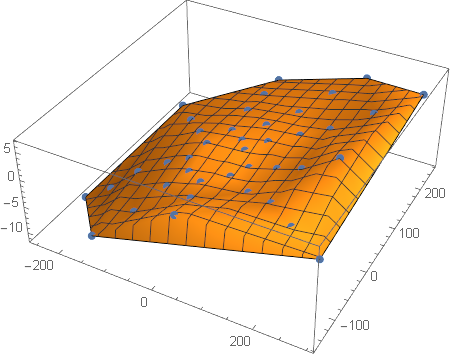
Try this for a first quick peek
points={{246.7324167,0.00,7.10}, {177.559151,0.00,3.16}, {129.3307785,0.00,1.79},
{73.7401973,0.00,0.35}, {301.4453862,184.73,7.16}, {230.615791,141.32,4.66},
{167.8426427,102.85,2.72}, {124.2035556,76.11,2.29}, {78.21467149,47.93,1.79},
{44.98182824,27.56,0.72}, {153.2948799,255.13,2.10}, {116.4919424,193.88,2.04},
{82.42641359,137.18,1.22}, {50.02360697,83.25,1.66}, {26.90771238,44.78,0.85},
{-29.07592991,236.80,-1.59}, {-21.94129167,178.70,-0.72}, {-14.44200479,117.62,0.41},
{-7.724793261,62.91,0.47}, {-162.4405078,118.02,-2.47}, {-115.3964627,83.84,-1.84},
{-64.65769234,46.98,-0.28}, {-31.05480297,22.56,0.16}, {-254.9257666,-44.95,-11.84},
{-200.4123632,-35.34,-9.22}, {-143.8440447,-25.36,-4.97}, {-85.87993507,-15.14,-2.34},
{-44.39391678,-7.83,-0.84}, {-129.4433228,-154.26,-6.59}, {-85.53635016,-101.94,-4.90},
{-50.10709269,-59.72,-2.34}, {-26.06581085,-31.06,-1.03}, {31.79428036,-137.72,1.16},
{19.3068332,-83.63,-0.53}, {11.04386284,-47.84,-0.59}, {296.0032747,-131.79,1.79},
{224.4301864,-99.92,2.29}, {170.3007905,-75.82,2.72}, {106.6403049,-47.48,0.41},
{53.23023651,-23.70,-0.09}};
interp=Interpolation[points,InterpolationOrder->1];
Plot3D[interp[x,y],{x,-260,310},{y,-160,260}]