MODERATOR NOTE: coronavirus resources & updates: ⭐ [COVID] Computational Research HUB For Novel Coronavirus: Data, Code, Visualizations, Notebooks - Staff Picks - WOLFRAM COMMUNITY

6 Likes
Hi Mads! I see you’re just a short jump up the road in Los Angeles. We are lucky to have such rich sources of data here at the State, County, and Municipal levels. One way to help residents understand it is in terms of how fast it’s affecting their population. Here’s an example with death rates, but I think you could adapt the idea to infection rates:
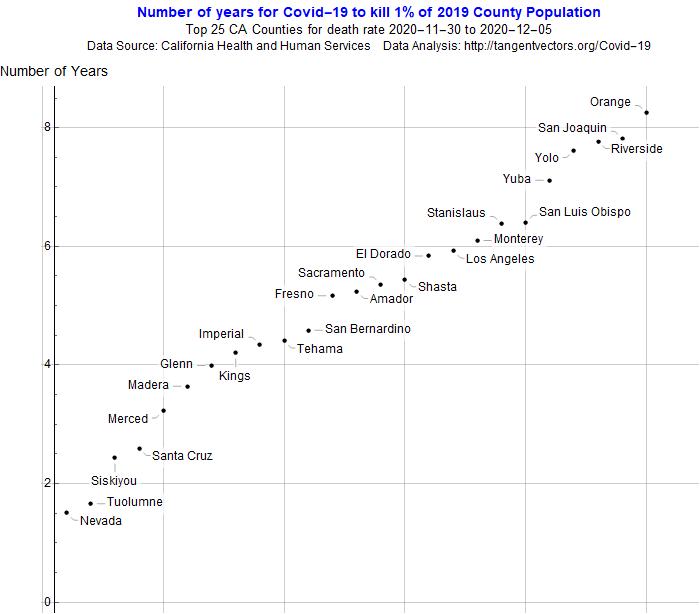
Another approach that seems work are charts of actual data with modeled projections - one portraying the current trend and another with a very optimistic trend:

 – you have earned Featured Contributor Badge

Your exceptional post has been selected for our editorial column Staff Picks http://wolfr.am/StaffPicks and Your Profile is now distinguished by a Featured Contributor Badge and is displayed on the Featured Contributor Board. Thank you!
1 Like
That’s a nice source but 56 charts are overwhelming. I wanted to see one or a few counties individually. Digging deeper I saw the counties are Entities so my question is how allow a county to be selected as a user option, text name or otherwise.
Yes, if your needs are varying counties on an almost daily basis then building a user interface is warranted. Otherwise if you are interested in more or less the same counties every couple of weeks then batch output like this works:

1 Like
I used the functions to retrieve data for my county. Everything worked fine until the recent surge. On a plot of deaths the latest data was not shown but the plot shading was extended from the last point at a constant level. With help from Wolfram support I learned one had to add ,PlotRange → Full option to DateListPlot. That fixed the problem.


1 Like
You can get the data directly by using this resource function: https://resources.wolframcloud.com/FunctionRepository/resources/CaliforniaCOVID19Data/
For example:
ResourceFunction["CaliforniaCOVID19Data"]["Cases"]
1 Like