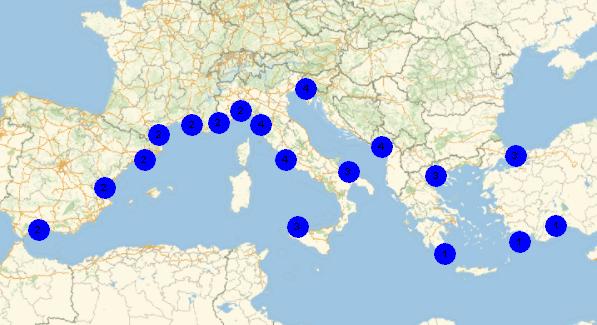
I have these data (coordinates of meteo stations) and the class (1, 2 ,3 ,4) :
{{36.867, 30.733}, {1}, {41.283, 2.067}, {2}, {41.133,
  16.783}, {3}, {44.413, 8.838}, {2}, {40.977, 28.815}, {3}, {36.274,
  23.017}, {1}, {36.667, -4.483}, {2}, {43.45, 5.233}, {2}, {43.658,
  7.216}, {2}, {38.176, 13.091}, {3}, {42.74, 2.871}, {2}, {43.684,
  10.393}, {4}, {36.405, 28.086}, {1}, {41.8, 12.233}, {4}, {40.52,
  22.971}, {3}, {42.367, 19.25}, {4}, {45.677,
  13.754}, {4}, {39.489, -0.482}, {2}}
And I want a map, with each station draw with a marker for each class
Thanks
A. Dauphine