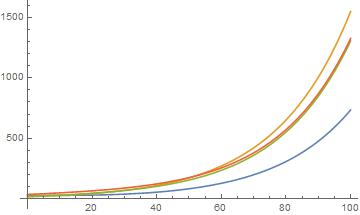
Hi everyone,
I do not have much experience with Mathematica and I am hoping to use it to display a system of four equations, where I can set and change the starting values and visualize how the system always reaches equilibrium. I’ve taken advanced math courses but it has been a while since I’ve tried to do something like this. I think I’ve been able to come up with the correct equations, but I’m struggling to find a way to visualize them. Can you help?
My code is below. I added in spaces for ease of reading. I also attached them as a Wolfram file.
Plot [ {A (x >= 1) == ((G (x - 1))/25) - ((A (x - 1))/25) +
    A (x - 1),

  G (x >= 1) == ((T (x - 1))/25) - ((A (x - 1))/50) + ((G (x - 1))/
      50) + G (x - 1),

  T (x >= 1) == ((A (x - 1))/25) - ((A (x - 1))/75) + ((G (x - 1))/
      75) + ((T (x - 1))/75) + T (x - 1),

  Y (x >= 1) == ((A (x - 1))/25) - ((A (x - 1))/75) + ((G (x - 1))/
      75) + ((T (x - 1))/75) + Y (x - 1),

  A (x < 1) == 30,

  G (x < 1) == 20,

  T (x < 1) == 15,

  Y (x < 1) == 35},

 {x, 0, 100}
 ]