
DOWLOAD-DESKTOP-NOTEBOOK.nb (1.38 MB)
18 Likes
 – you have earned Featured Contributor Badge

Your exceptional post has been selected for our editorial column Staff Picks http://wolfr.am/StaffPicks and Your Profile is now distinguished by a Featured Contributor Badge and is displayed on the Featured Contributor Board. Thank you!
1 Like
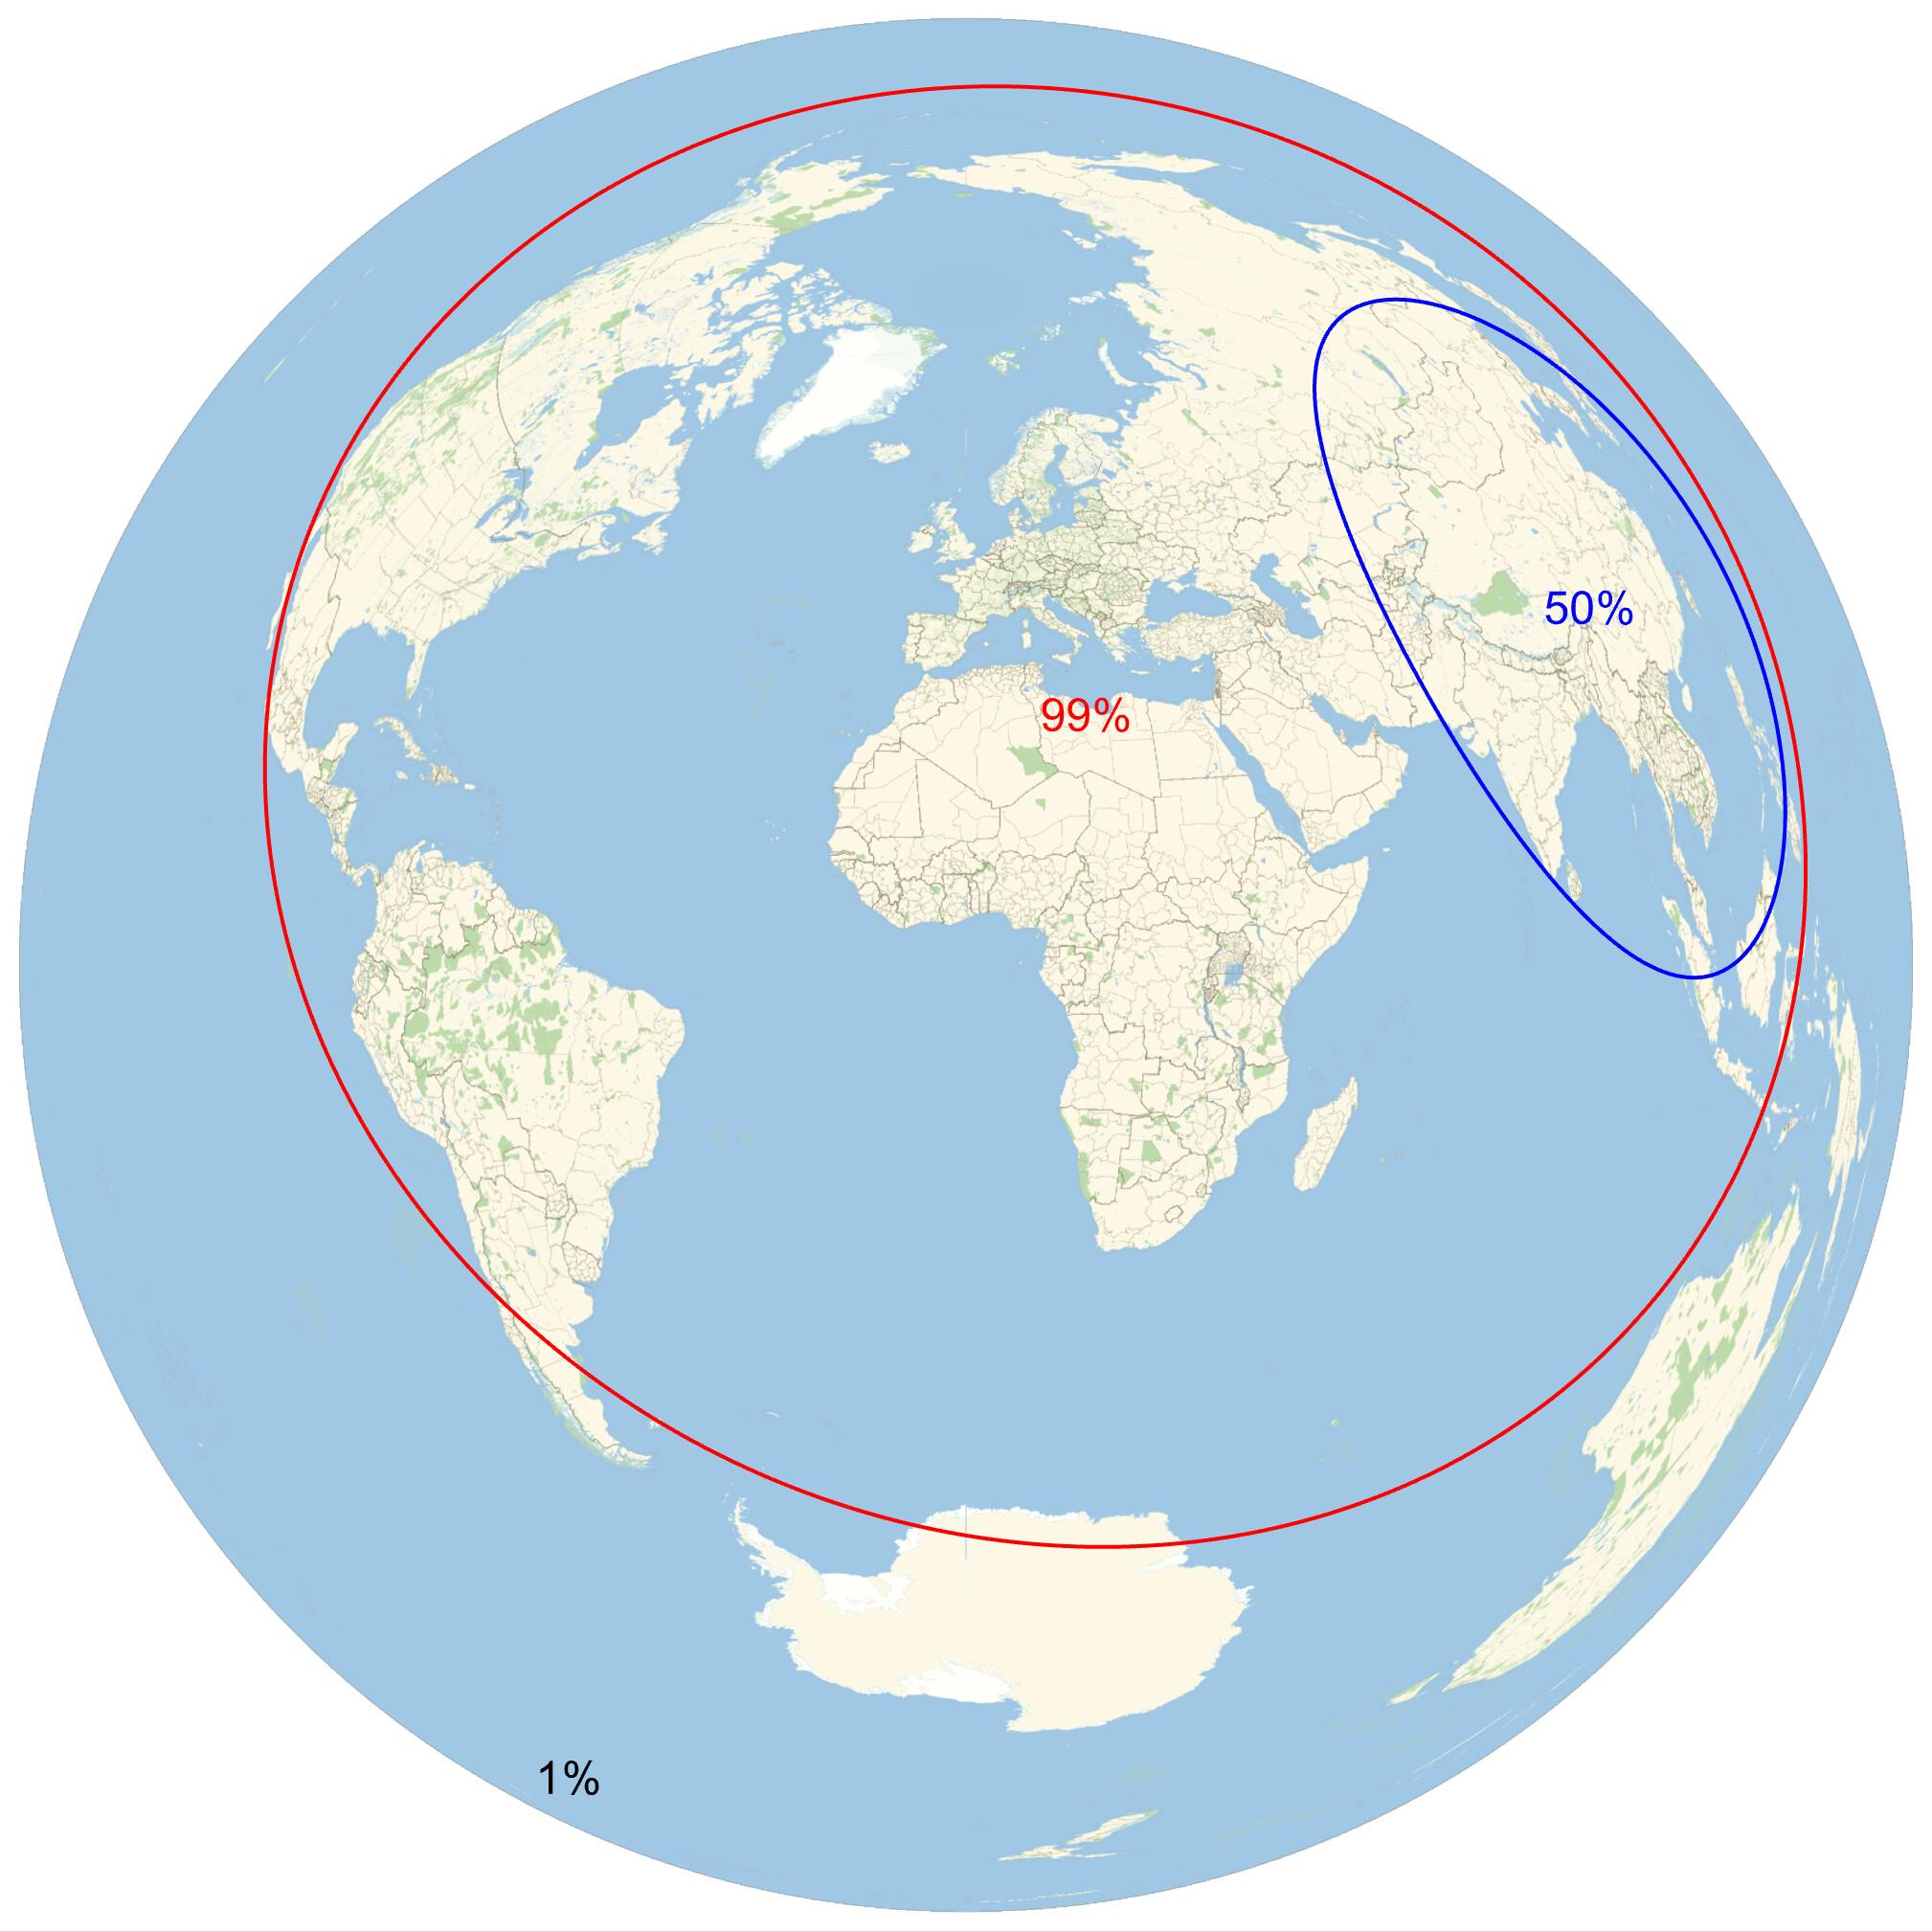
This great! I used this recently to build another data visualization using your Valeriepieris circle parameters:

I was a bit surprised and also asked by other people why Tokyo and Java Island, Indonesia are not in the circle. But to my another surprise I found a research article where results are pretty similar ( DOI ):

5 Likes
I checked the code used in that article some months ago, and it builds confidence on reasonable validity of my solution; it’s certainly a separate, and different implementation for the search, yet produces basically the same result. Both rely on effectively the same dataset, so it better be good… 
2 Likes
This is very interesting data, and it produces very interesting maps. I was wondering what would be the best projection in this context, and I believe an equal-area projection could be most useful because it would allow us to compare population against area. If we also want an azimuthal projection, which I think is a good choice, then “LambertAzimuthal” would be the projection to use, perhaps with a centering at the center of one of these circles, like the orthographic map above.
3 Likes
Choosing a good whole-planet projection is indeed a pain point for map of any kind, especially once one has learned how all projections have their limitations!
Some different centerings for Lambert azimuthal (equal area):


And Mollweide:


3 Likes
Yes, Mollweide is also a good choice, indeed. Thanks for the new maps!
1 Like