I am working on large dataset of size 10*10^6 and would like to visualize data. But it takes lot of time to plot. Any suggestions to plot fast without loss of data is appreciated. I also want to save the plot in pdf of optimal size and can be easily viewed.
For example:
x = RandomReal[{0, 2}, {10000000}];
y = RandomReal[{0, 100}, {10000000}];
ListLinePlot[{x, y}\[Transpose], PlotRange -> All]
Mathematica creates vector graphics instead of raster graphics. Usually this is a good thing. But rending 10*10^6 data points in a vector graphic is a bit much. It’s not that big of a deal usually when making a raster graphic.
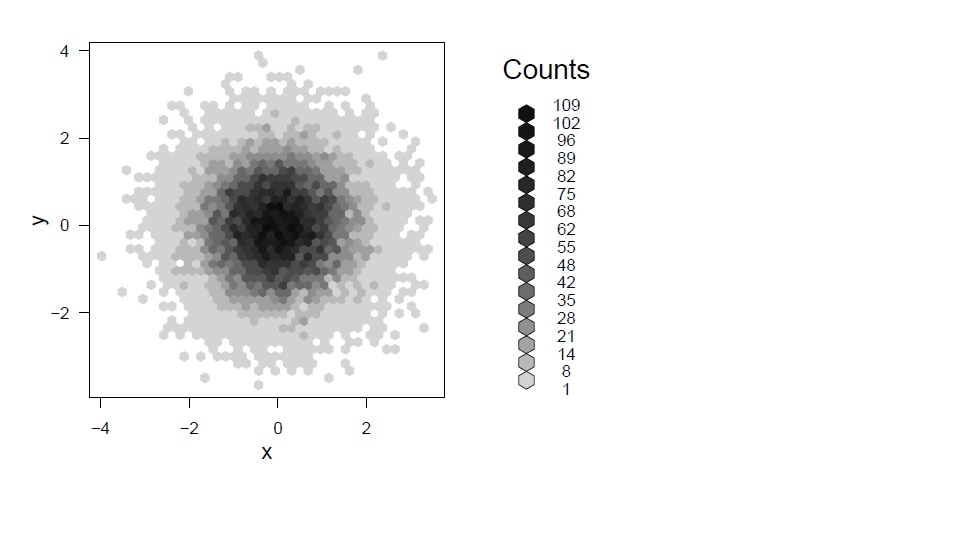
Fortunately, you rarely - if ever - actually want to plot that many points. For the most part, you’ll want to make a Histogram or a DensityPlot of some kind. Very often people plot many points instead of making a DensityPlot as a kind of stand in for a DensityPlot.
If rendering is actually the problem, you might want to work with Images instead of Graphics. You could implement a scatter plot for example fairly easily as an Image or an array using ArrayPlot.