Hello,
f[x_] := x^2
Plot[{f[x], f[1], f[2]}, {x, 0, 3}, PlotRange -> {{0, 5}},
 PlotLegends -> "Expressions"]
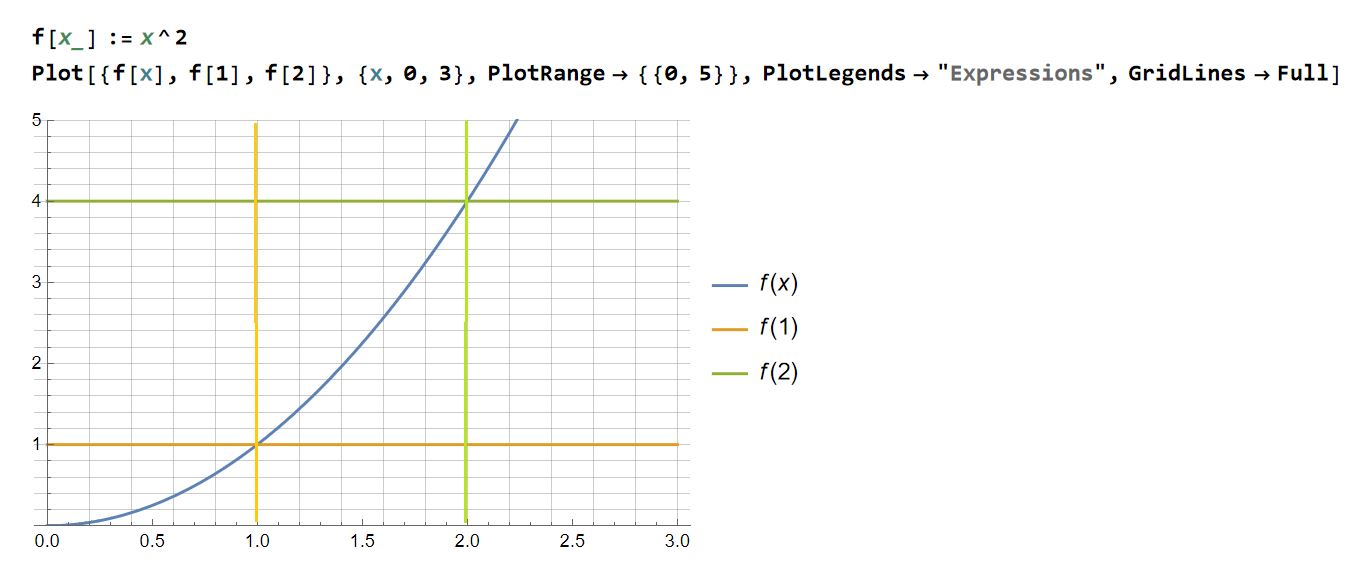
How could I plot lines on the x-axis at the points x=1 and x=2 (the points of the function f1 and f2)?
Something like that:
or
or
or
or
Thank you.
One possibility is to use the option GridLines:
Plot[{f[x], f[1], f[2]}, {x, 0, 3}, PlotRange -> {{0, 5}},
 PlotLegends -> "Expressions", GridLines -> {{1, 2}, None}]
or simply:
Plot[f[x], {x, 0, 3}, PlotRange -> {{0, 5}}, GridLines -> Transpose[{#, f[#]} & /@ {1, 2}]]
Hello,
I come back to this post a little:
How could I plot lines also for the x-axis, but not restrict one of the Gridlines axes?
Another reason why I’m interested in this is that the lines that Gridlines gives us for the x-axis are sometimes harder to see (I don’t know how I could edit them to look about the same thickness as f1 and f2 and to have the same color or any color than Gridlines gives us by default), and on the other hand we restrict the display of Gridlines for one axis (x-axis) (maybe someone still would like to have displayed on both axes Gridlines).
Is it possible this thing?
The below image was edited…to better understand how I would like the lines to look for x=1 and x=2.
or