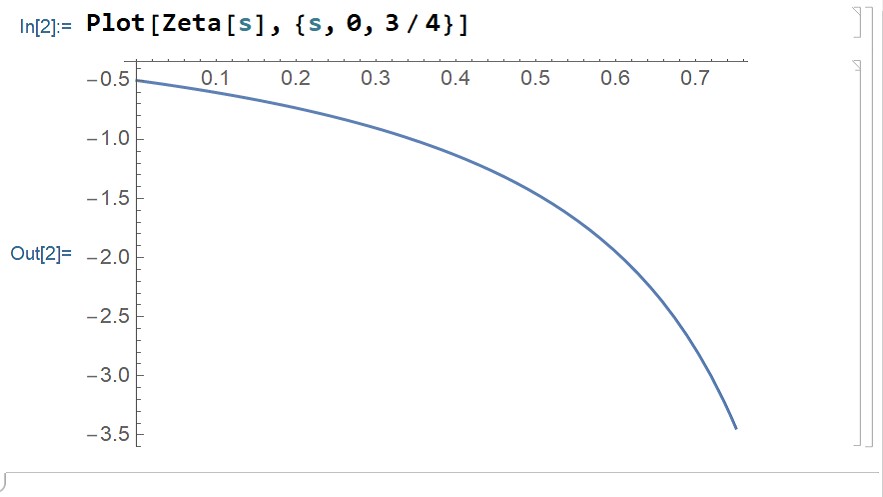
It pisses me off that Mathematica doesn’t use old school math standards when producing a graph.
Here it has put the graph upside-down, the negative y -values above the x -axis:
And here it changed the graph to make it look like anything but what I would be pleased to see(0,0) :
How do I fix this?
hdolhaine
February 25, 2021, 11:34pm
2
Plot[Zeta[s],{s,5/4,2},AxesOrigin->{0,0},PlotRange->{{0,2},{0,5}}]
ahmed
February 26, 2021, 1:15pm
3
Hi Jose,
To be more specific, I was able to change the direction of the Y-axis using Frame
or you can simply use the option PlotRange to show some positive part on Y-Axis to force the plot to put the curve under X-Axis