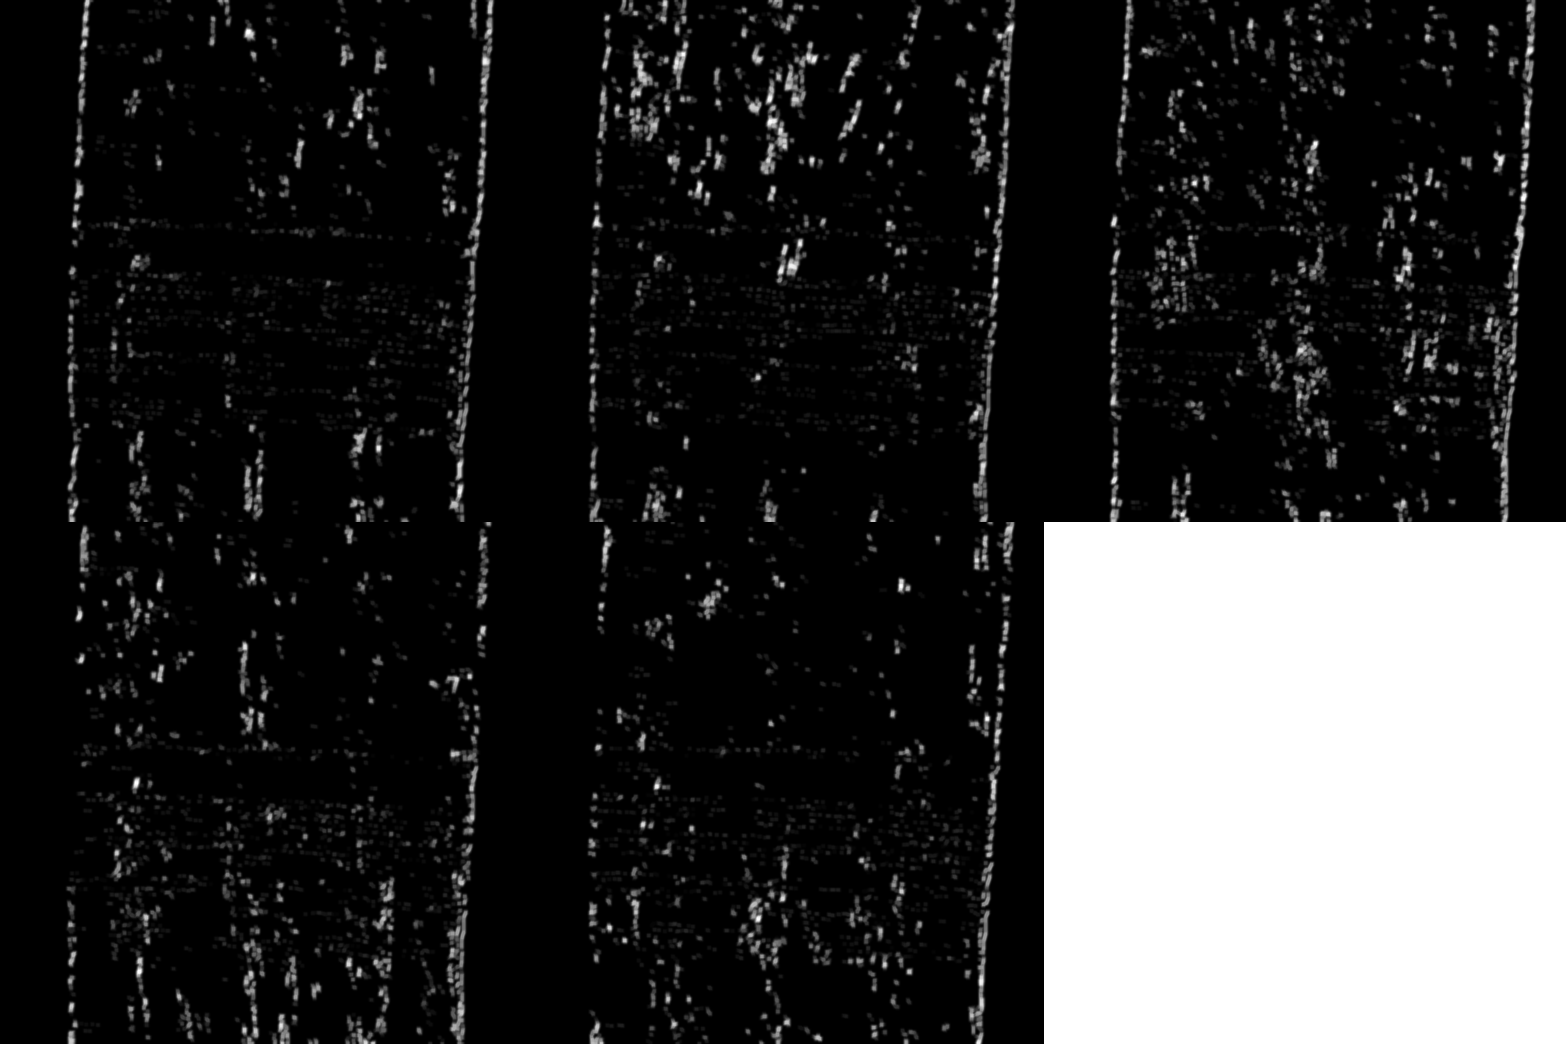
I am currently doing post-processing of a weak and fast-moving pattern (actually waves, if you are familiar with Schlieren Imaging…)
Now the problem is that, other than by directly showing the raw images and measure by hand, I have no good ways to visualize it neatly or extract any data from it (the main point of the post-processing is to find out the frequency! Or even more ambitiously, the velocity of the wave moving…)
In a nutshell, what I have in mind about the problem is that:
The patterns are weak, hence any operation of noise removal would hurt it
The background is uneven and noisy
The patterns move too quickly: within four or five frames the patterns would pass by the whole range of image
Here are an example of images: I have selected 3 that are representative.
Maybe take a Fourier transform at every pixel? That is, treat each pixel value as a function of time and take the FT of a the sequence of image gray scale values at that pixel. Then average over all pixels. This can perhaps give an estimate of frequency and speed.
this might be just a first step; the basic idea is to emphasize vertical structures by using GradientOrientationFilter. So at least one has the impression that “something is passing by”. In the following I am using the images from your animated gif, because this contains 5 images instead of only 3.