Hi,
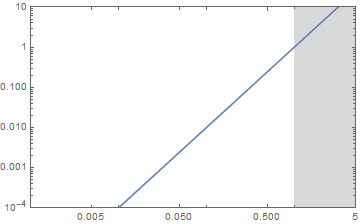
I would like to ask for help on how color everything to the right of a vertical line in a LogLogPlot? From the line to the right y axis.
I made the following:
LogLogPlot[x^2, {x, 0, 2 Pi}, PlotRange -> {{0.001, 5}, {10^-4, 10}},
 Epilog -> Line[{{Log[1], Log[10^-4]}, {Log[1], Log[10]}}],
 Frame -> True]
I need to exclude all the area from x=1 and to the right, and therefore shade it. I tried with filling but it did not produce anything, and I also tried to make a rectangle using graphics rectangle, but it can not show together with my LogLogPlot.
Thank you in advance,