Introduction
In this
MathematicaVsR project
we discuss and exemplify finding and analyzing similarities between texts using
Latent Semantic Analysis (LSA). Both Mathematica and R codes are provided.
The LSA workflows are constructed and executed with the software monads LSAMon-WL, [AA1, AAp1], and LSAMon-R, [AAp2].
The illustrating examples are based on conference abstracts from
rstudio::conf
and
Wolfram Technology Conference (WTC),
[AAd1, AAd2].
Since the number of rstudio::conf abstracts is small and since rstudio::conf 2020 is about to start
at the time of preparing this project we focus on words and texts from RStudio’s ecosystem of packages and presentations.
Statistical thesaurus for words from RStudio’s ecosystem
Consider the focus words:
{"cloud","rstudio","package","tidyverse","dplyr","analyze","python","ggplot2","markdown","sql"}
Here is a statistical thesaurus for those words:

Remark: Note that the computed thesaurus entries seem fairly R-flavored.
Similarity analysis diagrams
As expected the abstracts from rstudio::conf tend to cluster closely –
note the square formed top-left in the plot of a similarity matrix based on extracted topics:
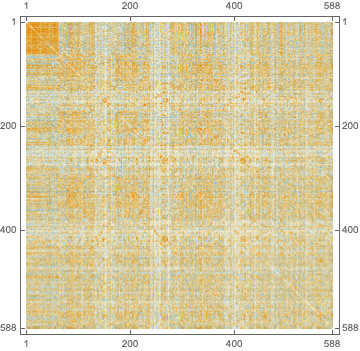
Here is a similarity graph based on the matrix above:

Here is a clustering (by “graph communities”) of the sub-graph highlighted in the plot above:

Notebooks
-
Mathematica
-
R
Comparison observations
LSA pipelines specifications
The packages LSAMon-WL, [AAp1], and LSAMon-R, [AAp2], make the comparison easy –
the codes of the specified workflows are nearly identical.
Here is the Mathematica code:
lsaObj =
  LSAMonUnit[aDesriptions]?
   LSAMonMakeDocumentTermMatrix[{}, Automatic]?
   LSAMonEchoDocumentTermMatrixStatistics?
   LSAMonApplyTermWeightFunctions["IDF", "TermFrequency", "Cosine"]?
   LSAMonExtractTopics["NumberOfTopics" -> 36, "MinNumberOfDocumentsPerTerm" -> 2, Method -> "ICA", MaxSteps -> 200]?
   LSAMonEchoTopicsTable["NumberOfTableColumns" -> 6];
Here is the R code:
lsaObj <-
  LSAMonUnit(lsDescriptions) %>%
  LSAMonMakeDocumentTermMatrix( stemWordsQ = FALSE, stopWords = stopwords::stopwords() ) %>%
  LSAMonApplyTermWeightFunctions( "IDF", "TermFrequency", "Cosine" )
  LSAMonExtractTopics( numberOfTopics = 36, minNumberOfDocumentsPerTerm = 5, method = "NNMF", maxSteps = 20, profilingQ = FALSE ) %>%
  LSAMonEchoTopicsTable( numberOfTableColumns = 6, wideFormQ = TRUE )
Graphs and graphics
Mathematica’s built-in graph functions make the exploration of the similarities much easier. (Than using R.)
Mathematica’s matrix plots provide more control and are more readily informative.
Sparse matrix objects with named rows and columns
R’s built-in sparse matrices with named rows and columns are great.
LSAMon-WL utilizes a similar, specially implemented sparse matrix object, see [AA1, AAp3].
References
Articles
[AA1] Anton Antonov,
A monad for Latent Semantic Analysis workflows,
(2019),
MathematicaForPrediction at GitHub.
[AA2] Anton Antonov,
Text similarities through bags of words,
(2020),
SimplifiedMachineLearningWorkflows-book at GitHub.
Data
[AAd1] Anton Antonov,
RStudio::conf-2019-abstracts.csv,
(2020),
SimplifiedMachineLearningWorkflows-book at GitHub.
[AAd2] Anton Antonov,
Wolfram-Technology-Conference-2016-to-2019-abstracts.csv,
(2020),
SimplifiedMachineLearningWorkflows-book at GitHub.
Packages
[AAp1] Anton Antonov,
Monadic Latent Semantic Analysis Mathematica package,
(2017),
MathematicaForPrediction at GitHub.
[AAp2] Anton Antonov,
Latent Semantic Analysis Monad R package,
(2019),
R-packages at GitHub.
[AAp3] Anton Antonov,
SSparseMatrix Mathematica package,
(2018),
MathematicaForPrediction at GitHub.