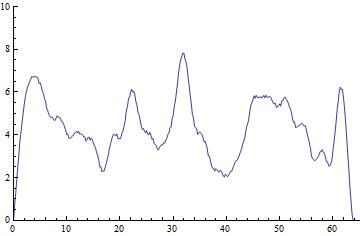
I have some experimental data which is well-fitted by 40 terms of a Fourier series.

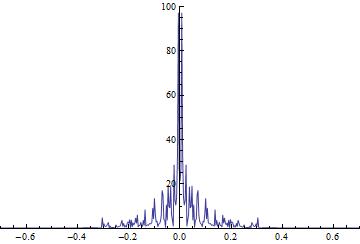
I want to know if the oscillation exhibited is signal or noise. I evaluated the code shown below to plot my data in the frequency domain:

Thanks for your help, in advance!
[1]: http://community.wolfram.com//c/portal/getImageAttachment?filename=1.jpg&userId=815788
[2]: http://community.wolfram.com//c/portal/getImageAttachment?filename=2.jpg&userId=815788