Hi,
I just started learning mathematica.
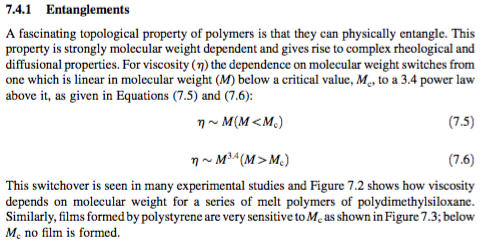
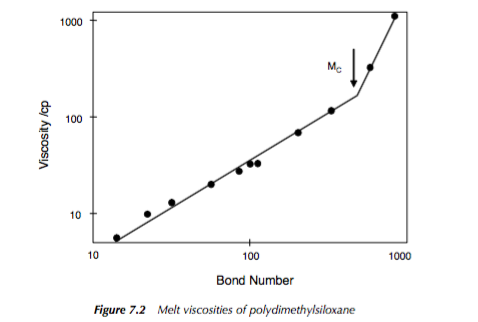
I’m trying to plot this plot the graph for viscosity vs molecular weight (attached pictures Formula 1 and
books plot2 from Cosgrove book of colloidal sciences.)
I first try to sum functions (linear part EE(M) and non linear part EE(M)) but I don’t think it works like that (line 3).
So I used the “IF” command and it seems it is also wrong (line 5). I think I have problem with defining functions and parameters in mathematica.
My .nb file is attached and
I appreciate your help.
P.S: Also look at line7 why mathematica doesn’t plot when I use function’s name?
EE1[M1_] := a M1;
EE2[M1_] := a M1^3.4;
Plot[{a M1 + a M1^3.4}, {M1, 1, 100}, PlotRange -> Automatic]
Mc = 54;
ee[M_] := If[M < Mc, M, M^3.4](*ee is viscosity [\eta]*)
Plot[If[M < Mc, M, M^3.4], {M, 1, 100}, PlotRange -> Automatic]
Also why this code doesn’t plot manipulate when i use function’s name
Thanks for the reply,
I see that manipulate expression that you sent works, thank you. However, the graph doesn’t look like what I see in book (figure attached). I think I have problem with PlotRange..?, maybe plotting conditional functions are different? \Eta is a function of M if M is less than Mc=600 M then \Eta is linear , if M is greater than Mc then plot is non linear.