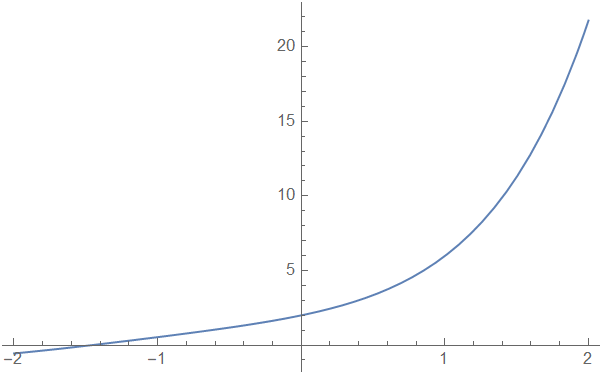
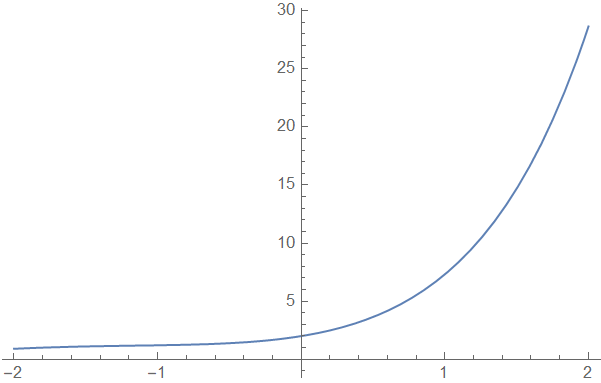
In order to study characteristics such as the monotonic value range of a function, it is necessary to draw the function and its guide function into the same coordinate system.
for example:
use this code can plot the function
Thank you very much!
The result is beyond imagination!
However, there is still an obvious problem: the derivatives of the original function are not identified, that is, the function signature in the image does not show that the derivative function is the derivative function of the original function.
Can you display the derivative function and show which derivative function it is at the same time?
Thanks again!
Specifically, it shows the function analytical expression of the derivative function in the image, and at the same time, it also shows the order of the derivative function of the original function.
thx
If you know how to differentiate then it is quite clear from the labels which order each curve corresponds to. Both can be displayed but the labels become long and high. The code is quite messy, good practice for you to refactor it to make it cleaner. Maybe you just want to display a number corresponding to the order rather than the differential operator, you can easily change the code to do that. Or maybe add a Tooltip to show the order, there are many possibilities…