Prediction of next values of a list according to another list

Dear all,

I have three lists as follows:

x1 = {3285.`, 3283.`, 3382.`, 3423.`, 3330.`, 3380.`, 3452.`,
        3409.`, 3373.`, 3380.`, 3325.`, 3359.`, 3371.`, 3301.`, 3339.`, 
       3421.`, 2573.`};
    
x2 = {3607.`, 3607.`, 3678.`, 3716.`, 3641.`, 3680.`, 3742.`,
        3706.`, 3676.`, 3683.`, 3650.`, 3676.`, 3688.`, 3641.`, 3653.`, 
       3729.`, 3770.`};
    
y = {551.147`, 551.158`, 551.158`, 551.175`, 551.174`, 
       551.171`, 551.142`, 551.125`, 551.109`, 551.124`, 551.115`, 
       551.105`, 551.097`, 551.106`, 551.086`, 551.097`, 551.063`};
    
   Correlation[y, x1]
    
   0.478399
    
    Correlation[y, x2]
    
   -0.337106

Now I would like to predict/estimate the next week’s values of y according to x1 and x2 list values using regression or machine learning methods.

Any help would be much appreciated.

Have you tried to use ListPlot to check for the relation between lists? Then you can decide whether to use LinearModelFit, NonlinearModelFit, or other?

Hi Ahmed,

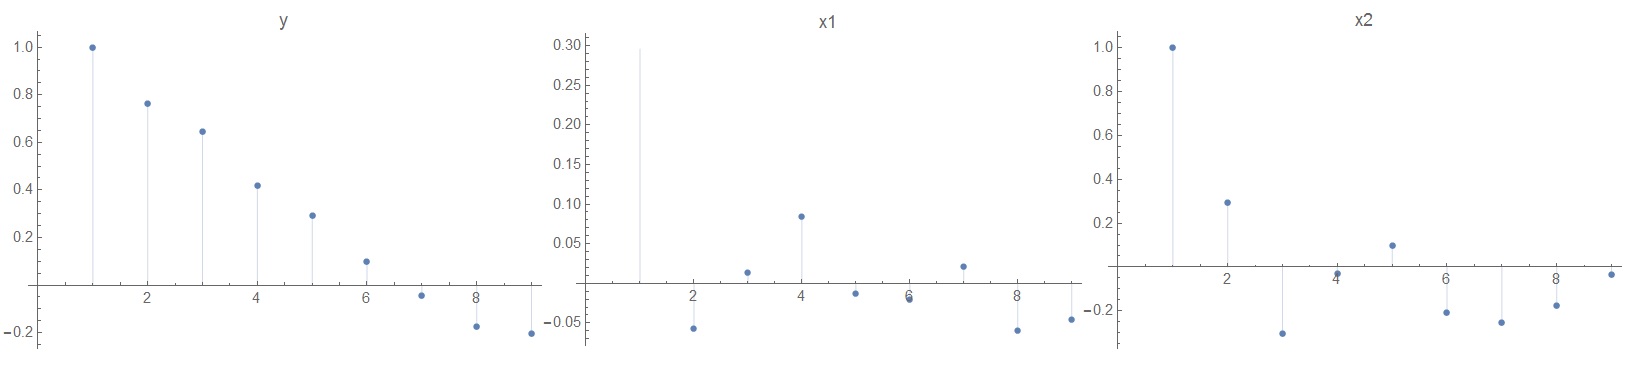
Thank you. I calculated the autocorrelation function for each list.

p1 = ListPlot[CorrelationFunction[y, {8}], Filling -> Axis, 
   PlotLabel -> "y"];

p2 = ListPlot[CorrelationFunction[x1, {8}], Filling -> Axis, 
   PlotLabel -> "x1"];

p3 = ListPlot[CorrelationFunction[x2, {8}], Filling -> Axis, 
   PlotLabel -> "x2"];

Style[Row[{p1, p2, p3}], ImageSizeMultipliers -> {1, 


1}]

I think I need a cross-correlation method. As you know, correlation is a linear measure of similarity between two signals. Cross-correlation is somewhat a generalization of the correlation measure as it takes into account the lag of one signal relative to the other. If lag == 0, then correlation = cross-correlation.Cross-correlation is particularly important to assess the causal relationship between two signals in time.

I did some things like the below:

In[10]:= temporalData = TemporalData[{Transpose[{y, x1}]}, Automatic];

In[11]:= correlations = 
 CorrelationFunction[temporalData, {-2, 2}]["Values"]

Out[11]= {{{0.647108, 0.436256}, {-0.0340549, 0.0141987}}, {{0.763739,
    0.289174}, {-0.0396631, -0.0567463}}, {{1., 0.478399}, {0.478399, 
   1.}}, {{0.763739, -0.0396631}, {0.289174, -0.0567463}}, \
{{0.647108, -0.0340549}, {0.436256, 0.0141987}}}

I am not sure about this approach. Please note that we should have a function like this :

Y18= F [ x1 (at t=17), x1(at t=16),…x2(at t=17), x2(at t=16),…,Y17, Y16,Y15,… ]

Thank you so much again, Ahmed.
[1]: https://community.wolfram.com//c/portal/getImageAttachment?filename=1233.jpg&userId=1822915