Quicksort is a popular sorting algorithm that recursively divides a list into two sublists: the parts of list smaller than and the parts larger than (or equal to) a chosen pivot. The pivot can be any member of the list or any number (mean, median,…) within the range of the list.
My goal is to visualise this algorithm by means of a live bar chart representing the list being sorted.
The idea is to do this by means of Animate or a Manipulate with Trigger or Animator as a control.
However, already in the simple case of dividing the list in two parts, I encounter problems: The example is very simple: I use an unsorted list of 30 or 50 random numbers between 1 and 100 and use as pivot either 15 or 50.
The following Manipulate is supposed to animate the progressive division of the list in parts that are smaller and parst larger than the pivot:
Manipulate[Module[{pivot, sample},
  pivot = n/2; sample = lst[[i]];
  If[sample < pivot,
   PrependTo[lst, sample]; lst = Delete[lst, i + 1]];
  BarChart[lst, GridLines -> {None, {pivot}}, BarSpacing -> 1]],
 {{i, 1}, 1, n, 1, Trigger, DisplayAllSteps -> True,
  AnimationRunning -> False, AnimationRepetitions -> 1},
 {{n, 30}, None},
 Initialization :> (lst = RandomSample[Range[n], n])]
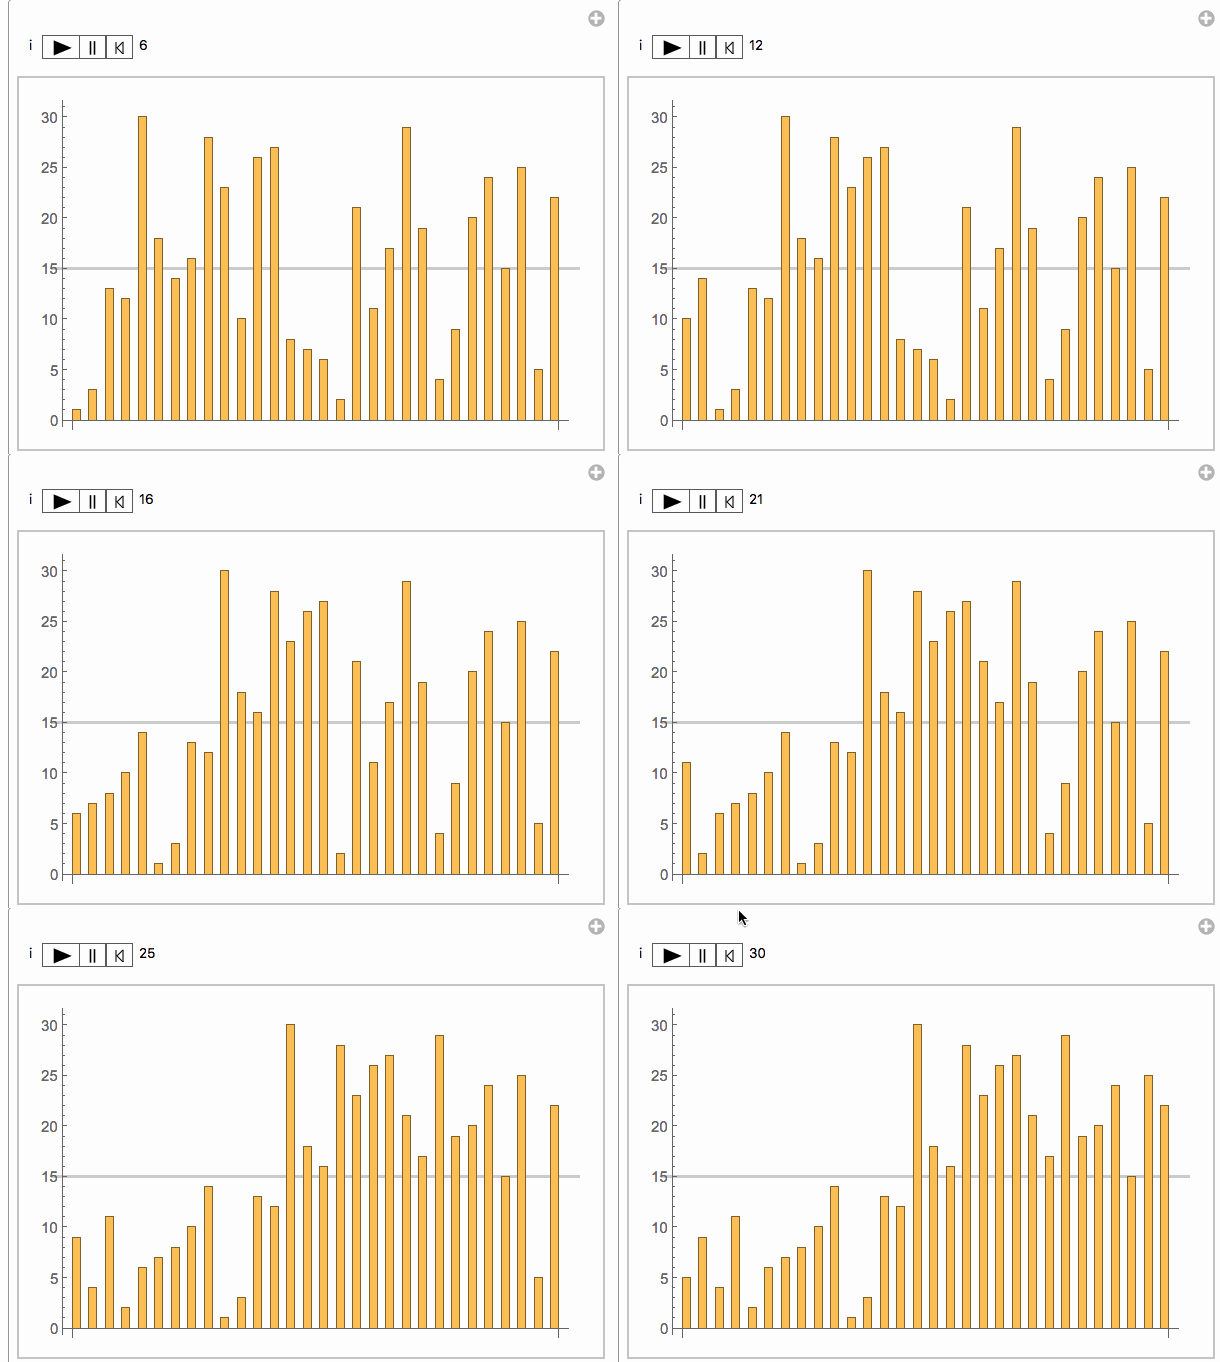
Now with n=30 (or any number smaller than 30), this works fine as one can see by running the Manipulate or see from this end result: The chart is divided into 2 sets of bars either smaller than or larger than the pivot (15)

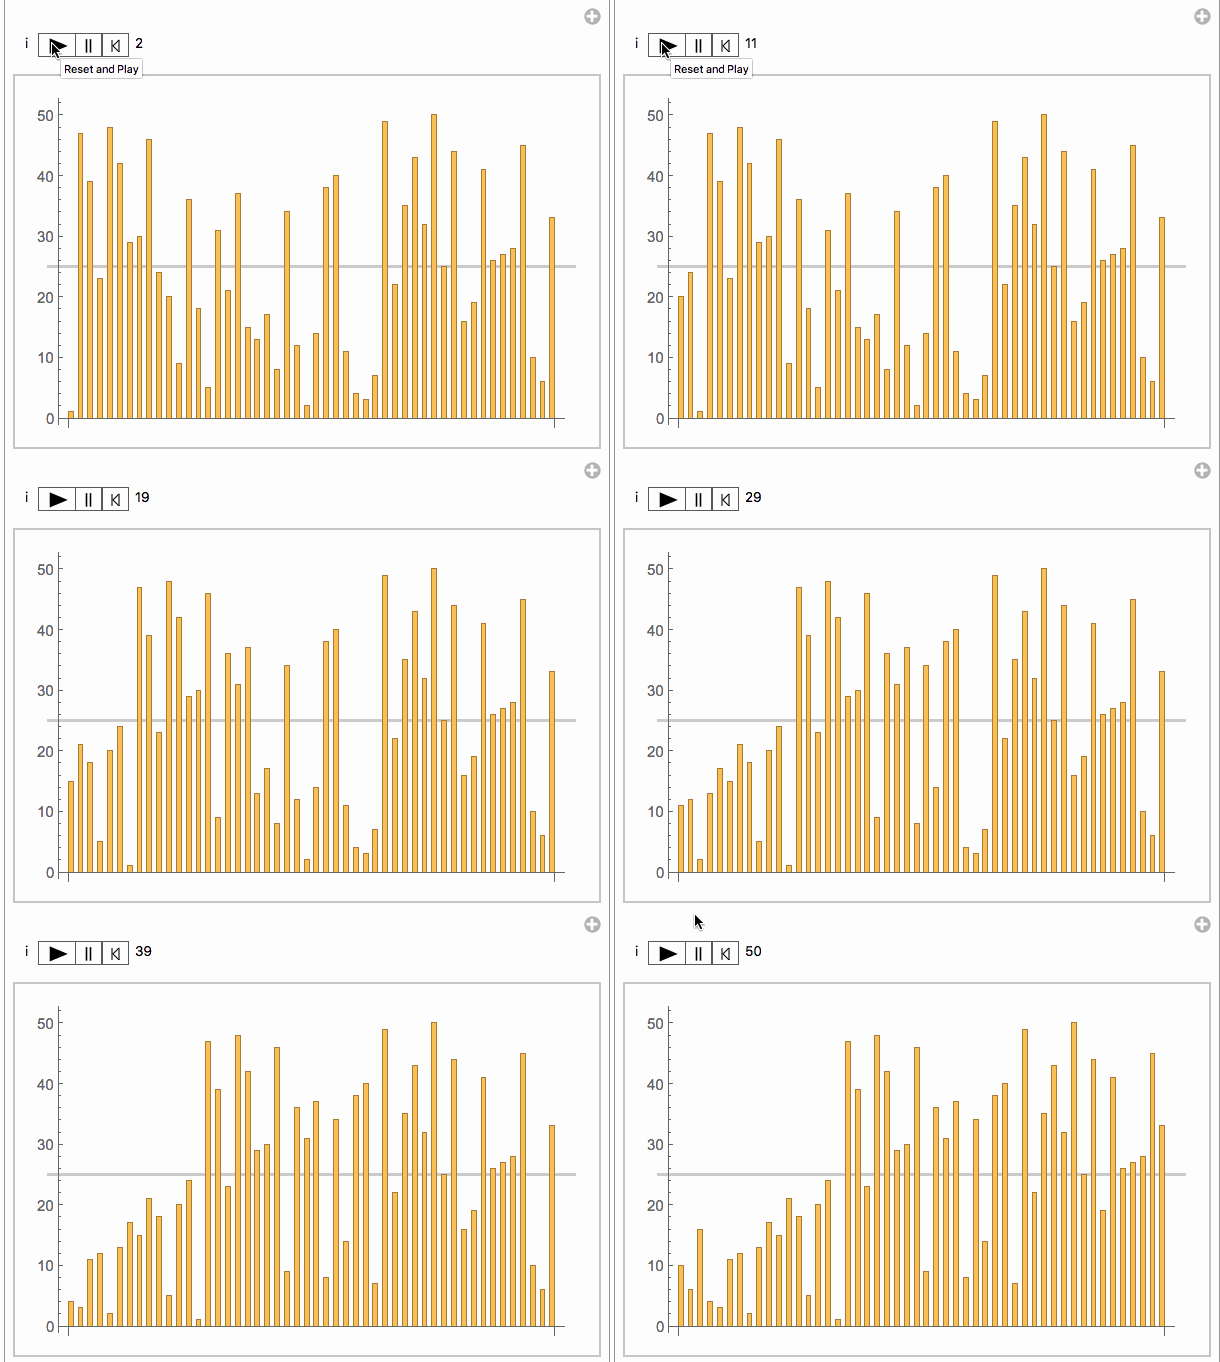
But, with n=50 (or any number >35), this does not work right as seen from this end result: The division is not correct since some of the smaller bars are in the part with the supposedly larger bars (pivot is 25)

This may not be the right way to do this but it should work?!
I would appreciate help in finding out what I am doing wrong? or indication of a better procedure to visualise this sorting algorithm.