Hi,
i have a question relating to generalized linear models. The Wolfram language has very powerful tools for the analysis of data built right into it. A really powerful tool is GeneralizedLinearModelFit. Generalized linear models are generalisations of the standard linear regression. They allow for non-normal distributions and appear to rapidly replace ANOVA. They are extremely useful to detect relationships among variables that allow to predict a target quantity.
On this website they describe the following example:
A researcher is interested in how variables, such as GRE (Graduate
Record Exam scores), GPA (grade point average) and prestige of the
undergraduate institution, effect admission into graduate school. The
response variable, admit/don’t admit, is a binary variable.
This is not a very unrealistic setting. They use R to analyse the data. The same can be achieved very easily with Mathematica, too, like this:
data = Import["http://www.ats.ucla.edu/stat/data/binary.csv"];
GeneralizedLinearModelFit[Reverse /@ data[[2 ;;]], {x, y, z}, {x, y, z}, ExponentialFamily -> "Binomial", NominalVariables -> x]["ParameterTable"]
The Reverse function is just to make sure that Mathematica gets the variables in the order it needs. Mathematica’s result looks like this:

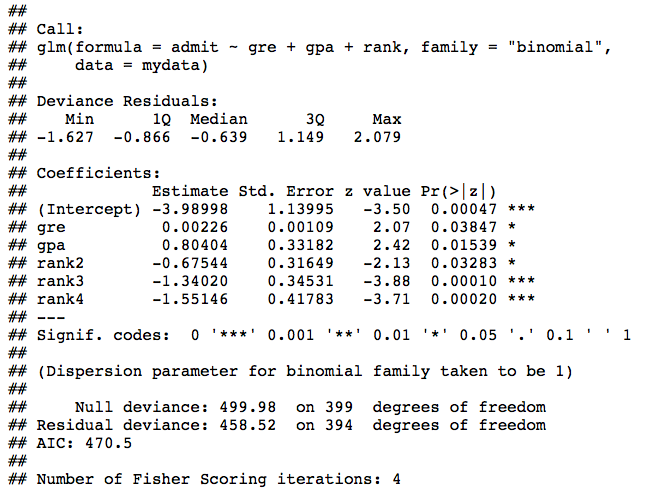
This seems to be correct but differs from the output of R which is:

The difference seems to be due to the nominal variable x, i.e. the variable for which four different choices for x: 1 - 4. These variables are not independent. Each student has one of the four. So knowing that it is not any of three choices allows you to conclude that it must be the fourth. In these situations both Mathematica and R choose one of the variables as a reference. In this particular case Mathematica chooses x4, i.e. the case when x is 4, and R chooses x1 as base level. In R there is a way to “re-level” this, so that the reference can be chosen by the user. I have tried to find a similar option in Mathematica, but I could not find one. Does anybody know what that option is?
Otherwise Mathematica and R obtain a similar solution, see for example all the Standard Errors and the values for GRE and GPE, resp, y and z. These estimates allow us to draw a conclusion about the relevance of the different variables: a larger value of the “Estimate” indicates a stronger influence. The signs indicate the direction of the influence. So in this case, coming from a rather low-level institution has a large negative impact on the probability to be admitted to the graduate school. This seems to be more important than the GPA or GRE.
Thanks for your help,
Marco
PS: If any developers read this, it would be cool to be able to do mixed effect models in Mathematica, too.