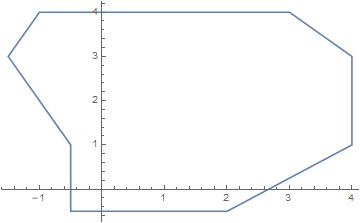
So far I use a listplot to create a geometry from a data point. Using the area feature, it requires using the region. Does anyone know how to make a geometry from point data using a region plot?
g = {{2, -0.5}, {4, 1}, {4, 3}, {3, 4}, {1, 4}, {-1, 4}, {-1.5,
    3}, {-1, 2}, {-0.5, 1}, {-0.5, -0.5}, {2, -0.5}};
ListLinePlot[g]
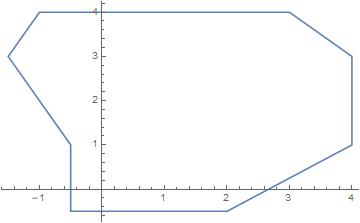
but when I used the area function its not a specific region.

thank you
[1]: https://community.wolfram.com//c/portal/getImageAttachment?filename=Untitled-5.jpg&userId=2648845
[2]: https://community.wolfram.com//c/portal/getImageAttachment?filename=Screenshot2022-10-14094838.png&userId=2648845