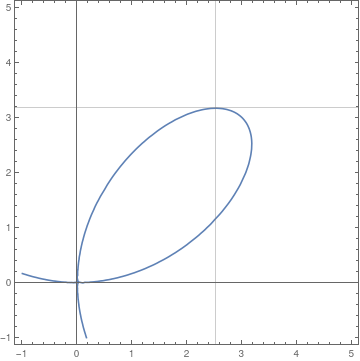
I am graphing the equation x^3+y^3=6xy and finding where the slopes of the tangent lines are equal to zero. So far I have graphed the original equation:
And I solved for the derivative:
Solve[Dt[x^3 + y^3 == 6 (x) (y), x], Dt[y, x]]
{{Dt[y, x] -> (x^2 - 2 y)/(2 x - y^2)}}
and the graph looks like this:
As you can see, the graph of the derivative has a zero at around 2.5, but the original graph looks like it’s at around 3. This is confusing. Am I missing something? Did I enter the derivative equation incorrectly? Please help.
Solve[x^3 + y^3 - 6 x y == 0, x]
Bears 3 equations, each must be examined.
Are you looking for a horizontal that is zero or vertical that is zero? If horizontal you see ~ 2.5 in the top graph, if vertical you see ~ 3 in the top graph. Assume you solved for y(x) and that m == y/x, then your 0 slope must be 0/x not y/0 because y/0 (is not defined, does not exist).
"“ODE” by Tenenbaum, Pollard has a thorough discussion on this same problem on page 15.
This implicit function was presented in a section of the book along with other functions which show that there are many situations in which ODE are not as simple as (examples designed to omit such details), how they can be treated, and so on.
Hello Elanor,
if I understand your question correctly, I can not see any problem:
eq = x^3 + y^3 == 6 x y;
eq1 = y /. Solve[eq, y][[1]];
xx = x /. Solve[D[eq1, x] == 0, x][[1]];
yy = eq1 /. x -> xx;
(* values of {xx,yy}:  {2 2^(1/3),2 2^(2/3)}, i.e. {2.519,3.174}  *)
ContourPlot[Evaluate@eq, {x, -1, 5}, {y, -1, 5}, Axes -> True, GridLines -> {{xx}, {yy}}]
Does that help? Regards – Henrik
[1]: https://community.wolfram.com//c/portal/getImageAttachment?filename=eqgr.png&userId=32203