
counties.nb (23.4 KB)
25 Likes
Hi John, Thanks for sharing. It seems a great code. But unfortunately I don’t have access to the website and data (see screenshot below). Please can you support me with the data? Your support will be highly appreciated ! Best Regards,…Jos

1 Like
Hi John, and thanks for sharing - very educational. One thing I don’t fully understand (and maybe you can explain it a bit?) is how you calculated the values for the legend.
E.g. when I’m retracing your steps, I don’t see any negative values in qq:
Min[qq]
0.134336
and
zz
{0.74857, 1.3628, 1.97704, 2.59127, 3.20551, 3.81974, 4.43397, \
5.04821, 5.66244}
What am I missing?
1 Like
My mistake. I originally used a moving average of 10 years for the smoothing, and then changed it to an exponential average. The values in the legend correspond to the moving average case. Looking at both figures, there really is not much of a difference. This is a problem when using a bespoke legend as I did.
I’m sure it would be possible to generate the legend automatically with the correct limits – and perhaps someone will be interested enough to show us how to do that – but for now I went back and edited my original post to correct everything. The figure and the file now use the moving average.
2 Likes

- Congratulations! This post is now featured in our Staff Pick column as distinguished by a badge on your profile of a Featured Contributor! Thank you, keep it coming, and consider contributing your work to the The Notebook Archive!
Excellent analysis! A quick question, what was the standard deviation in temperature measurements? I am asking that because some Delta T are small and I wonder to what extend we can interpret them as a meaningful shift in T?
2 Likes
Mads, that is a great question. All of the data I used are online at the site I referenced, and it would be easy to modify my code to get a map of the standard deviation by county.
John, I may be mistaken in decoding the file, but I believe the file shows about 17 county entries for Michigan and it has 83. For Arizona, the state code is 04 and has 15 counties. The file shows 58 counties being reported for 04. FYI. Thanks for the information as well as your analysis. Very Interesting.
Ed, you have to read the documentation for that file. As I said above, it does not contain the FIPS code, but a number that can be transformed into a FIPS code. And I showed how to do it.
Thank you. Must be my error in calculating the FIPS.
-Ed
John, the documentation’s state code reference was the key for me. Thank you again for the suggestion.
-Ed
The question I thought someone was going to ask is where did they get temperature data for counties that didnt even exist at the time. Arizona for example didnt become a state until 1912 and yet there are the average monthly temperatures for each of its current counties back to 1895. The answer is through kriging.
Great chart with potential for display of any year span.
John -
I used your post for a project with my kids this morning. Thanks for sharing this amazing work - they loved it and had a few ideas that they’d like to explore a bit more. Can’t wait to work on these ideas with them. Here’s what we did:
Great way to get the kids interested. I did much the same as you but experimented with different start years. TBP.
BTW the missing county is entirely an Indian reservation with no county seat. (I wonder why kriging was not used).
Mike, how nice to know you were able to use the code and data to teach your children. That’s why I posted it: hoping people would extend the analysis, try out different smoothing techniques, use different starting and ending points, etc. I watched your videos and it sounds like your boys have some good ideas. I’ll be interested to see what they come up with. Happy Father’s Day.
1 Like
I decided to publish my changes. I separated the temperature ranges at 0 so there’s no doubt as to the direction of change. Also the start date is 20 years later to see how the trend changes.

Very interesting Doug! In later versions of this map I too decided to use shades of blue for negative changes. It makes sense visually. You also see that the starting point makes a difference too. The map at the top of this page shows temperature changes between 1991 and 2012 compared to the average temperature between 1901 and 1960.
Starting point makes a difference - 1991 is a unique starting point. Mt. Pinatubo eruption.
Nearly 20 million tons of sulfur dioxide were injected into the stratosphere in Pinatubo’s 1991 eruptions, and dispersal of this gas cloud around the world caused global temperatures to drop temporarily (1991 through 1993) by about 1°F (0.5°C).
(The Cataclysmic 1991 Eruption of Mount Pinatubo, Philippines, Fact Sheet 113-97)
I’ll attach a run of your 10-year moving averages 1991-2012, not as year-specific but interesting.
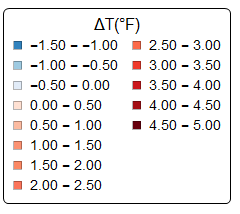
(Is there a way to embed the legend in the chart?)

!legend for climate by counties]1
1991-2012 means.pdf (4.15 MB)