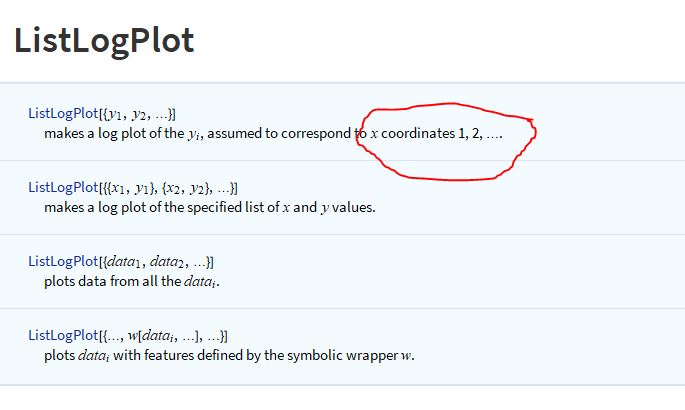
I’ve been experimenting with Mathematica and wanted to make a nice plot comparing the diameter of the moons in the solar system. I have a plot that I like, however I cannot identify what the x-axis represents. I have looked extensively in the documentation, looked at all properties of Mab (it is close to 150 on the x-axis, so I hoped to identify a property by it being close to 150 in value), tried sorting the list before plotting and did some Google searches. Can anyone help identifying what that axis means? Thanks in advance.
The code is: moons = PlanetaryMoonData[All, "Diameter", "EntityAssociation"]; ListLogPlot[moons, AxesLabel -> Automatic]
Hello Hans, in the absence of any other information, functions like ListPlot[] use the index of the list as the x-axis. Ganymede is the 11th element in the list ‘moons’, and so appears at x=11.
Thank you for your response. I have tested it by reversing the list and it does seem the case. Earlier I had sorted the list and didn’t note the differences so I thought I had ruled it out.