Yesterday the media reported that the celebrated data scientist Hans Rosling has passed away. He was a brilliant data science communicator. Here is one of the TED talks that he delivered. He was able to visualise large datasets and tell stories with the data. Here's some of his work from a BBC documentary. Professor Rosling was leading the Gapminder project, where he used innovative ways of visualising high dimensional socio-economical and political data. And while there are interactive online tools to generate some of his stunning visualisations, I wanted to generate one of them in the Wolfram Language. I still have a small issue with my code, which I will discuss below. This is what I will generate:
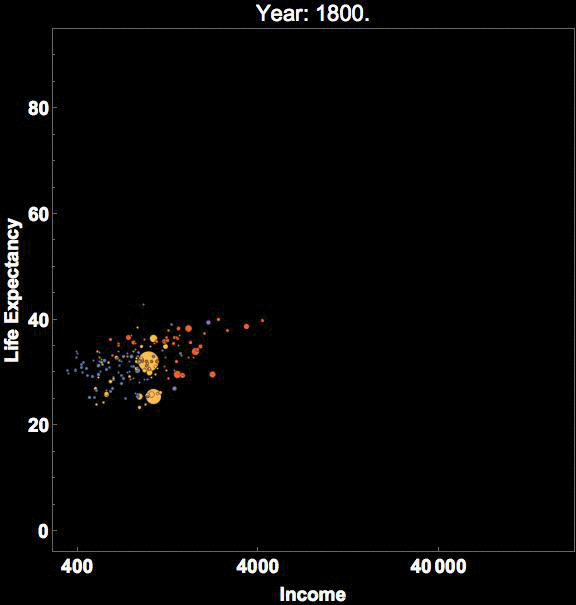
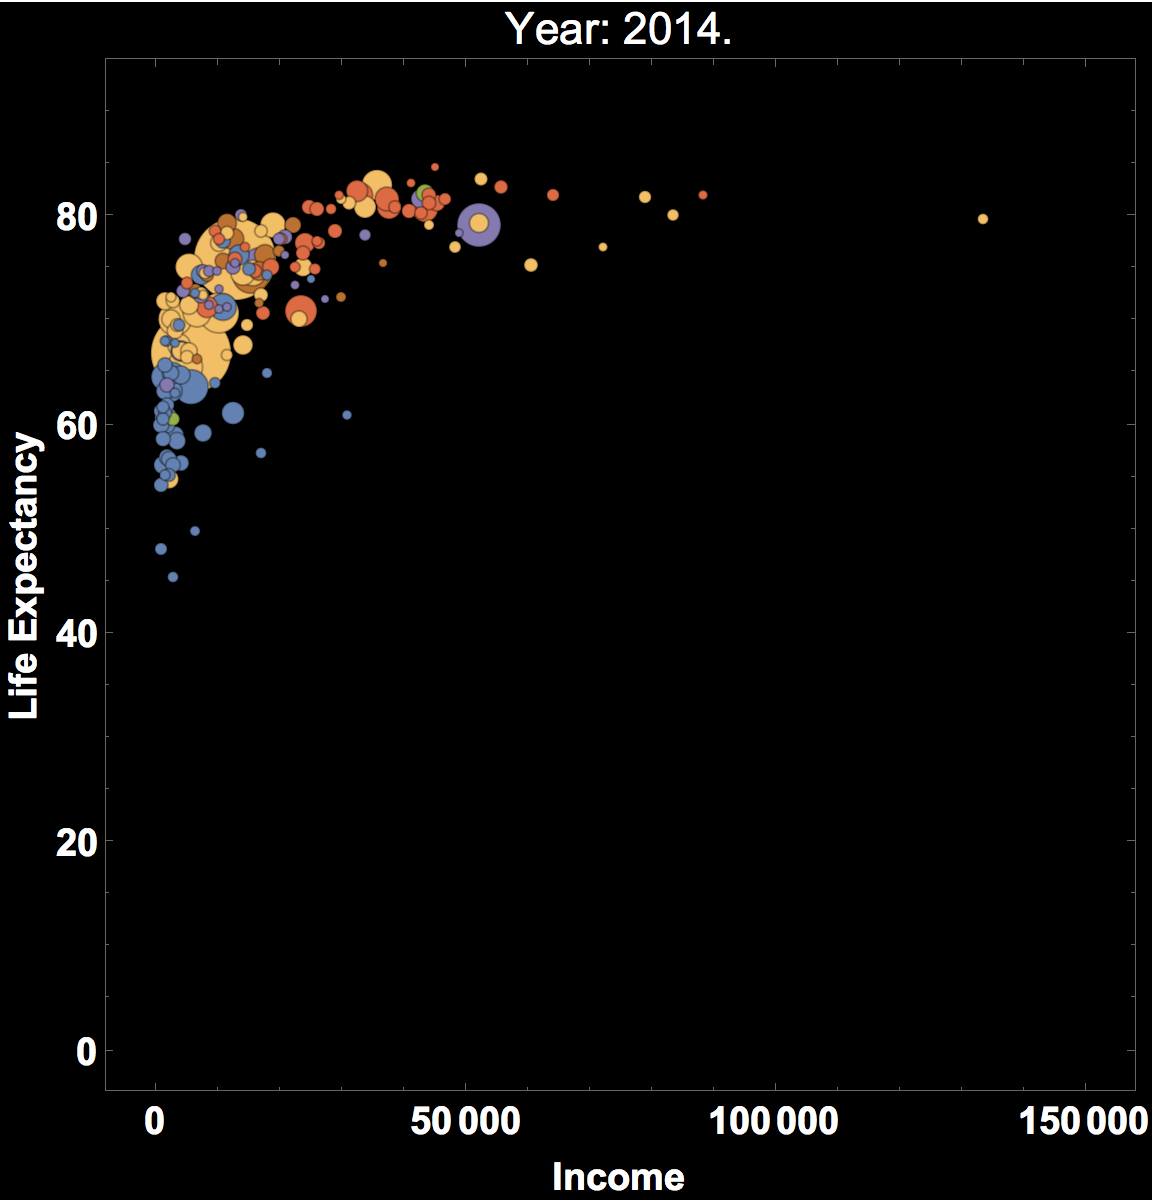
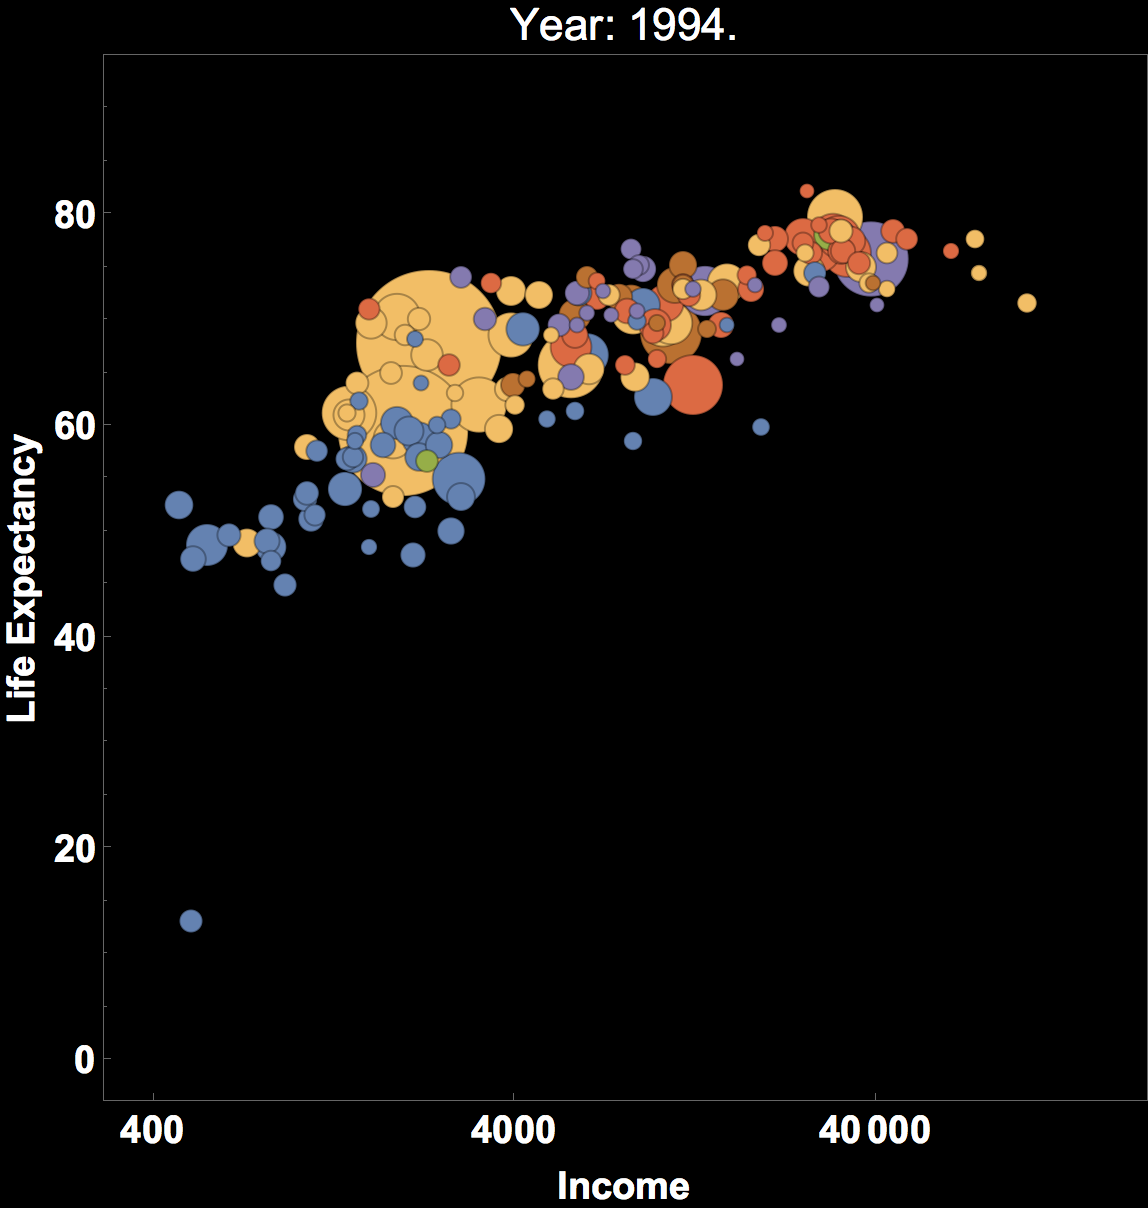
It represents a number of countries and their development over about 200 years. The position of the bubbles show the per capita income and the life expectancy, and the bubble size represents the population size. The colours of the bubbles represent the different continents. As you can clearly see there is a problem with the scaling of the bubbles because in some frames they suddenly appear to grow and then decrease in size again.
First I download three files from the Gapminder website (all attached). They contain data on income, life expectancy and population over many years. I tried to use Mathematicas curated data, but could not obtain all the data I needed. Importing the data is trivial.
countriesincomeraw = Import["/Users/thiel/Desktop/indicator gapminder gdp_per_capita_ppp.xlsx"];
countriespopraw = Import["/Users/thiel/Desktop/indicator gapminder population.xlsx"];
countriesliferaw = Import["/Users/thiel/Desktop/indicator life_expectancy_at_birth.xlsx"];
It turns out that the data is not available for all years. I therefore first use the first row of each file to determine the years for which all data points are available:
years = Intersection[countriesliferaw[[1, 1, 2 ;;]], countriespopraw[[1, 1, 2 ;;]], countriesincomeraw[[1, 1, 2 ;;]]]
Then I select the data for these years only:
incomeinter = Flatten[Position[countriesincomeraw[[1, 1]], #] & /@ years];
popinter = Flatten[Position[countriespopraw[[1, 1]], #] & /@ years];
lifeexpinter = Flatten[Position[countriesliferaw[[1, 1]], #] & /@ years];
Next, I compile the data into a single list, in a form that is easier to handle:
alldata = Select[GatherBy[Join[countriesincomeraw[[1, 2 ;;, Join[{1}, incomeinter]]],
    countriesliferaw[[1, 2 ;;, Join[{1}, lifeexpinter]]], countriespopraw[[1, 2 ;;, Join[{1}, popinter]]]], First], Length[#] == 3 &];

alldataclean = {#[[1, 1]], #[[1, 2 ;;]], #[[2, 2 ;;]], #[[3, 2 ;;]]} & /@ alldata;
It turns out that there is a column with the country names in plain text. In Mathematica I prefer working with Entities. Therefore I convert the column:
countrierules = Rule @@@ Transpose[{alldataclean[[All, 1]], Interpreter["Country"][alldataclean[[All, 1]]]}];
fulldata = Select[alldataclean /. countrierules, Head[#[[1]]] == Entity &];
I could have used the Dispatch function, but this is very fast anyway, so no additional step was required. For the BubbleChart I also want to determine the continents the countries belong to (for the colouring). To achieve this, I define a function findCont (inspired by work by @Vitaliy Kaurov.
continents = EntityList[EntityClass["GeographicRegion", "Continents"]];
cont = {#, #["Countries"]} & /@ EntityList[EntityClass["GeographicRegion", "Continents"]];
findCont[country_] := Select[cont, MemberQ[#[[2]], country] &][[1, 1]]
SetAttributes[findCont, Listable]
So, once ore I modify my dataset:
datafinal = Select[Quiet[Transpose[{findCont /@ fulldata[[All, 1]], fulldata}]],Head[#[[1]]] == Entity &];
What follows now is the actual plot command:
BubbleChart[#[[All, 1 ;; 3]] & /@
GatherBy[SortBy[Select[Append[datafinal[[#, 2, {2, 3, 4}]][[All, 80]],
    Position[continents, datafinal[[#, 1]]][[1, 1]]] & /@
Range[Length[datafinal]], ! MemberQ[#, ""] &], Last], Last],
    FrameLabel -> {"Income", "Life Expectancy"}, LabelStyle -> Directive[Bold, 19, White],
    PlotRange -> {{0, 150000}, {1, 90}}, Background -> Black,
    PlotLabel -> Text[Style["Year: " <> ToString[years[[80]]], 22]], ImageSize -> Large]
I wanted a logarithmic x-axis but this did strongly not work with the build in function of the scaling of axes. Therefore I did it manually:
BubbleChart[
Transpose[{Log[#[[All, 1]]], #[[All, 2]], #[[All, 3]]}] & /@
GatherBy[SortBy[Select[Append[datafinal[[#, 2, {2, 3, 4}]][[All, 60]],
Position[continents, datafinal[[#, 1]]][[1, 1]]] & /@
Range[Length[datafinal]], ! MemberQ[#, ""] &], Last], Last], FrameLabel -> {"Income", "Life Expectancy"},
LabelStyle -> Directive[Bold, 19, White], PlotRange -> {{6, 12}, {1, 90}}, Background -> Black,
FrameTicks -> {{Automatic, None}, {Transpose[{Log[Table[4.*10^k, {k, 0, 4}]], Table[4*10^k, {k, 0, 4}]}], None}},
PlotLabel -> Text[Style["Year: " <> ToString[years[[60]]], 22]], ImageSize -> Large]
The following piece of code would then produce the frames for the animation:
Monitor[Quiet[frames = Table[BubbleChart[Transpose[{Log[#[[All, 1]]], #[[All, 2]], #[[All, 3]]}] & /@
GatherBy[SortBy[Select[Append[datafinal[[#, 2, {2, 3, 4}]][[All, k]],
Position[continents, datafinal[[#, 1]]][[1, 1]]] & /@ Range[Length[datafinal]], ! MemberQ[#, ""] &], Last], Last],
    FrameLabel -> {"Income", "Life Expectancy"}, LabelStyle -> Directive[Bold, 19, White],
    PlotRange -> {{6, 12}, {1, 90}}, Background -> Black,
    FrameTicks -> {{Automatic, None}, {Transpose[{Log[Table[4.*10^k, {k, 0, 4}]], Table[4*10^k, {k, 0, 4}]}], None}},
    PlotLabel -> Text[Style["Year: " <> ToString[years[[k]]], 22]], ImageSize -> Large], {k, 1, 81}];], k]
I can then export the frames:
Monitor[Do[Export["~/Desktop/Gapminder/frame" <> ToString[1000 + k] <> ".jpg", frames[[k]]], {k, 1, Length[frames]}], k]
and use a command line tool like
convert -delay 35 -loop 0 frame*.jpg animated.gif
to produce the movie. As you can see there is this problem of the bubble sizes being automatically rescaled in different frames. To some extent that spoils the animation. I did try to avoid this by manually scaling the size of the bubbles. First I would need to determine the Max and Min of the population sizes of all countries and years:
{min, max} = MinMax[Flatten[Table[#[[All, 3]] & /@
GatherBy[SortBy[Select[Append[datafinal[[#, 2, {2, 3, 4}]][[All, k]], Position[continents, datafinal[[#, 1]]][[1, 1]]] & /@
Range[Length[datafinal]], ! MemberQ[#, ""] &], Last], Last], {k, 1, 81}]]]
I can then define a function:
size = Rescale[#, {min, max}, {0.01, 0.4}] &
to resize the bubbles. That looks somewhat like this:
BubbleChart[Transpose[{Log[#[[All, 1]]], #[[All, 2]], #[[All, 3]]}] & /@
GatherBy[SortBy[Select[Append[datafinal[[#, 2, {2, 3, 4}]][[All, 60]],
Position[continents, datafinal[[#, 1]]][[1, 1]]] & /@
Range[Length[datafinal]], ! MemberQ[#, ""] &], Last], Last],
FrameLabel -> {"Income", "Life Expectancy"},
LabelStyle -> Directive[Bold, 19, White], PlotRange -> {{6, 12}, {1, 90}},
Background -> Black, BubbleSizes -> Evaluate@{size[Min[#[[All, 3]] & /@
GatherBy[SortBy[Select[Append[datafinal[[#, 2, {2, 3, 4}]][[All, 60]],
Position[continents, datafinal[[#, 1]]][[1, 1]]] & /@ Range[Length[datafinal]], ! MemberQ[#, ""] &], Last], Last]]],
size[Max[#[[All, 3]] & /@ GatherBy[SortBy[Select[Append[datafinal[[#, 2, {2, 3, 4}]][[All, 60]],
Position[continents, datafinal[[#, 1]]][[1, 1]]] & /@ Range[Length[datafinal]], ! MemberQ[#, ""] &], Last], Last]]]},
FrameTicks -> {{Automatic, None}, {Transpose[{Log[Table[4.*10^k, {k, 0, 4}]], Table[4*10^k, {k, 0, 4}]}], None}},
PlotLabel -> Text[Style["Year: " <> ToString[years[[60]]], 22]], BubbleScale -> "Area", ImageSize -> Large]
Unfortunately, this does not the trick either. You can see that when you compare frame 60 (code above) with frame 59 (you exchange every 60 by 59). The population sizes hardly change but the bubble size changes substantially. I am not sure whether there is a documented or undocumented option to force the bubble to behave like I want them to behave, i.e. not to rescale the sizes. In general the rescaling is a very useful thing but if we compare the development over multiple frames, this is not quite what we want.
There is, of course, always the possibility to define a BubbleChart diagram from scratch (myBubbleChart or so), but for this post I will not do that. You can also see @Frederick Wu 's post, where he does produce the bubble chart by hand.
The bubble charts, especially in an animation, are very useful. They encode two variables in the position -a three dimensional bubble chart would allow you to encode an additional variable-, one in their size, one (ideally categorical), one in their colour, and one via the time course. You could make the bubbles into ellipses and change the shape of the markers in other ways. That allows us to encode up to 8 dimensional data sets in one graph. Then each bubble represents one country. It is quite amazing how much data can be visualised in this simple way.
Cheers,
Marco
 Attachments:


